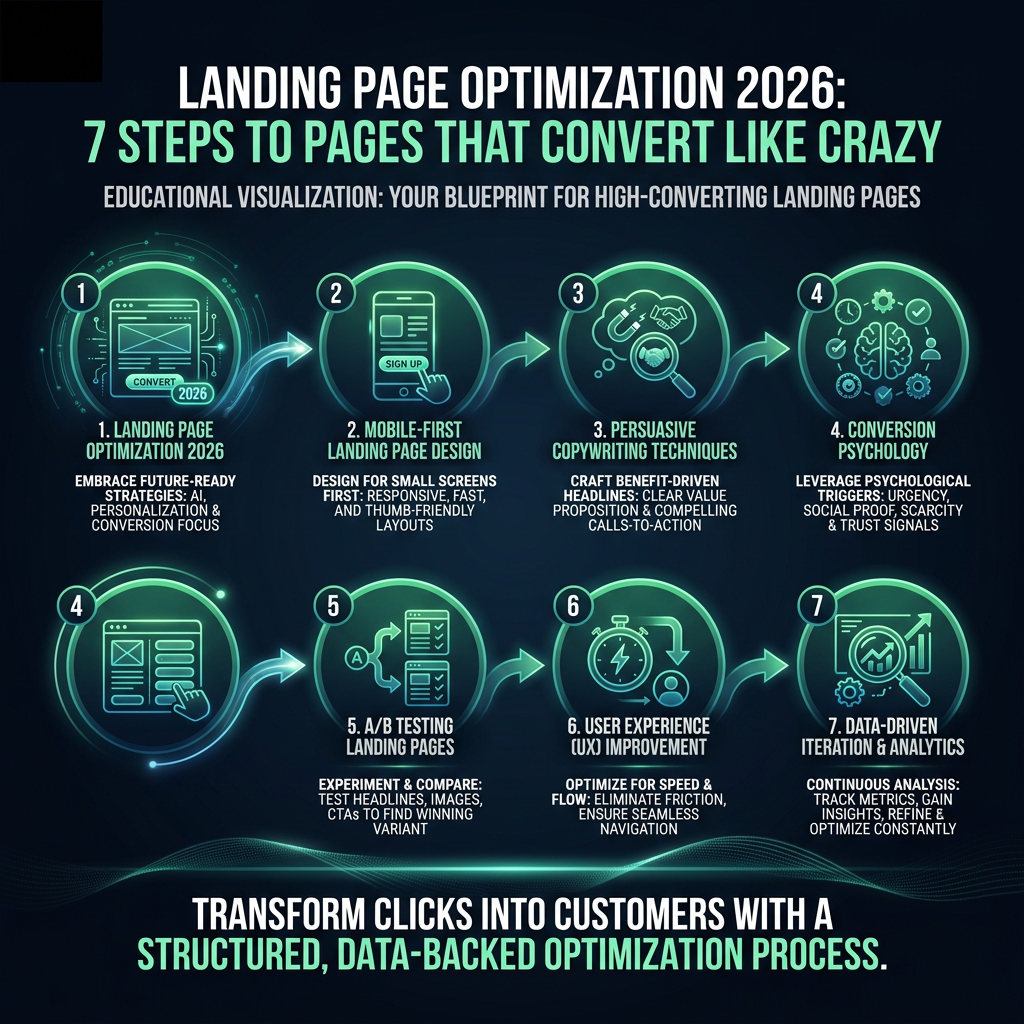

Landing page optimization is the process of making one page convert more of the specific traffic sent to it. You do it in a fixed order: match the page to its traffic source, make one offer obvious within seconds, answer doubts with proof, remove form friction, make the call to action unmistakable, fix speed on mobile, then measure and test. Each step below says what to check, gives a before/after example and names the number that tells you whether it worked.
How do you optimize a landing page? The 7-step process
The order matters: testing button colours on a page whose headline contradicts the ad wastes traffic. Steps 1 and 2 decide whether a visitor stays, steps 3 to 5 whether they act, and steps 6 and 7 protect and prove the gains.
Step 1: Match the message to the ad or source
What to check: open the exact ad, email or post that sends traffic, then open the page. The headline should repeat the promise of the source in similar words. Offer, price, image and tone should match. Google Ads rates landing page experience as one of the three components of Quality Score, alongside expected click-through rate and ad relevance, and describes it as how relevant and useful the page is to people who click the ad (Google Ads Help, "About Quality Score for Search campaigns").
Before: ad says "Free 14-day trial of payroll software for restaurants"; page headline says "The all-in-one HR platform". After: page headline says "Payroll for restaurants. Free for 14 days", with the same kitchen photo the ad used.
How to measure: compare engagement rate and conversion rate per ad group or campaign in GA4. A source with a clearly lower engagement rate than others to the same page usually has a scent problem. Our guides on ad scent for Google Ads landing pages and visual scent between Meta ads and landing pages cover this in detail. If you run Performance Max, check final URL expansion, which can send paid clicks to pages you never designed for them; see how to stop Performance Max sending traffic to your homepage.
Step 2: One offer, one headline that passes a 5-second test
What to check: the page should make one offer. Nielsen Norman Group's analysis of dwell-time data ("How Long Do Users Stay on Web Pages?") found that the first 10 seconds are when visitors are most likely to leave, so the page has to state its value immediately. Show the above-the-fold area to five people for five seconds, then ask: what is offered, who is it for, and what should you do next? If fewer than four of five answer all three, rewrite.
Before: "Empowering teams to do their best work." After: "Book a 20-minute demo: see how Acme closes month-end books in 3 days instead of 10." The second names the outcome, the audience and the action. The method is set out in how to run a 5-second test on hero headlines.
How to measure: 5-second test pass rate (aim for at least 4 of 5), plus scroll depth and engagement rate before and after the change.
Step 3: Place proof where doubt appears
What to check: list the three objections a visitor has at each point of the page, then put the matching proof right next to it. Price doubt sits next to the price. Security doubt sits next to the form. "Will this work for a company like mine?" sits next to the headline.
Before: six generic testimonials ("Great product!") in a carousel at the end of the page. After: one quote with name, job title, company and a number, placed directly under the form: "We cut onboarding from 3 weeks to 4 days. Maria Lopez, Head of Ops, Brightwave." Plus a line under the submit button: "No credit card. We never share your email."
How to measure: form start rate (visitors who focus the first field divided by page views) and form completion rate (submits divided by starts). Proof near the form should move completion; proof near the hero should move scroll and start rate.
Step 4: Reduce form friction
What to check: count fields and ask of each one, "Would sales refuse this lead without it?" If not, remove it or collect it later. Use visible labels above fields; Nielsen Norman Group's article "Placeholders in Form Fields Are Harmful" explains that placeholder-only labels disappear as people type and hurt recall and accessibility.
Before: 9 fields including phone, company size, budget, job title and "How did you hear about us?". After: 4 fields (work email, name, company, team size as a dropdown), with enrichment filling the rest. See how many form fields a lead form should have for the trade-off between lead volume and lead quality.
How to measure: field-level drop-off (custom GA4 events on field focus and blur), completion rate, and the sales-qualified rate of the leads.
Step 5: Design and write the CTA
What to check: there is one primary action, it has the strongest contrast on the screen, and the button text describes what the visitor gets rather than what they do. Secondary actions (such as "Watch a 2-minute video") are visually quieter.
Before: grey "Submit" button next to a blue "Learn more" link of the same size. After: high-contrast "Get my demo time" button, with "Pick a slot in the next 48 hours" as microcopy below. More patterns are in CTA button text that converts.
How to measure: CTA click-through rate (clicks divided by page views) and the share of clicks going to the primary versus secondary actions.
Step 6: Fix speed and mobile (LCP, INP, CLS)
What to check: Google's web.dev documentation defines "good" Core Web Vitals as Largest Contentful Paint of 2.5 seconds or less, Interaction to Next Paint of 200 milliseconds or less, and Cumulative Layout Shift of 0.1 or less, each measured at the 75th percentile of page loads. "Poor" starts above 4 seconds, 500 milliseconds and 0.25. On landing pages, the usual causes are a large uncompressed hero image (LCP), heavy tag managers and chat widgets (INP) and cookie banners or late-loading fonts that push the form down (CLS).
Before: 2.4 MB hero video, LCP 4.8 s on mobile, form jumps when the cookie banner loads. After: compressed still image with explicit width and height, chat widget loaded on interaction, banner reserved space. LCP 2.1 s, CLS 0.02.
How to measure: field data from PageSpeed Insights or the Chrome UX Report for the URL, and conversion rate split by device. A large desktop/mobile conversion gap is often a speed or layout problem.
Step 7: Measure and test
What to check: conversion tracking fires once per real conversion, the primary metric is defined (for example, demo requests divided by unique visitors), and every test starts from a written hypothesis: "Because we observed X, changing Y will improve Z, measured by M." Use how to write an A/B test hypothesis as a template.
Before: "Let's try a green button." After: "Because field tracking shows the phone field has the highest drop-off of any field, removing it will raise completion rate, measured by submits divided by starts over 4 weeks."
How to measure: check whether your traffic can support a test before you run it. A common rule of thumb (Lehr's rule, 80% power, 5% significance) is: visitors per variant = 16 × p × (1 − p) ÷ d², where p is the baseline conversion rate and d is the absolute lift you want to detect. Landing page conversion rate optimization does not end at the form, either: the thank-you page is where a lead can book a meeting straight away.

Landing page optimization checklist
Print this and audit one page at a time. Every item you cannot tick is a candidate fix.
Message match and offer
- The headline repeats the promise of the ad, email or post that sends traffic.
- Offer, price and terms match the source exactly.
- The hero image or visual style matches the ad creative.
- Each major ad group or audience has its own page or dynamic headline.
- The page makes one offer, not several.
- At least four of five testers can say what, for whom and what next after 5 seconds.
- The headline names an outcome, not a category.
- Main navigation is removed or reduced to the logo.
Proof and trust
- Each key objection has proof placed beside it.
- Testimonials include a full name, role, company and a specific result.
- Logos or ratings appear near the headline for credibility.
- Privacy and "no credit card" reassurance sits under the submit button.
Form and friction
- Every field is one sales would refuse a lead without.
- Labels are visible above fields, not only placeholders.
- Error messages explain how to fix the input.
- Field types trigger the right mobile keyboard (email, tel, number).
- The form works with browser autofill.
- Field-level drop-off is tracked.
Call to action
- One primary CTA with the highest visual contrast on the screen.
- Button text says what the visitor gets.
- Microcopy under the button answers "what happens next?".
- The CTA is visible without scrolling on a mid-size phone.
- Repeated CTAs lead to the same action.
Speed and mobile
- LCP at or under 2.5 s at the 75th percentile on mobile.
- INP at or under 200 ms.
- CLS at or under 0.1, including cookie banners and fonts.
- Hero image is compressed and has explicit dimensions.
- Third-party widgets load after interaction or after the main content.
- Tap targets are large enough to hit with a thumb.
Measurement
- The conversion event fires once per real conversion.
- Conversion rate is reported by source, campaign and device.
- Each test has a written hypothesis and one primary metric.
- Required sample size is calculated before a test starts.
- The thank-you page has a next step (calendar, resource or referral).
Which landing page fixes should you prioritise first?
Score each audit finding one on impact (how many visitors it affects and how close it is to the conversion), confidence (how strong the evidence is) and effort (hours to ship), then work from the top. A simple score is impact × confidence ÷ effort, each on a 1 to 5 scale. For ICE, PIE and PXL compared side by side, see the CRO prioritization framework guide.