EyeCaptain
    CRO Prioritization Framework: ICE vs PIE vs PXL Compared

    CRO Prioritization Framework: ICE vs PIE vs PXL Compared

    Compare the ICE, PIE and PXL CRO prioritization frameworks, with a worked example scoring five test ideas, and a weekly routine to rank your backlog.

    Dimitris Andreadakis

    8 min read
    136 views
    CRO prioritization frameworkICE scoring modelPIE frameworkPXL frameworkhow to prioritize A/B test ideas

    A CRO prioritization framework scores each test idea on a few shared criteria so the team works on the highest value ideas first. ICE scores impact, confidence, and ease. PIE scores potential, importance, and ease. PXL replaces gut scores with yes or no questions about evidence and visibility. Pick one and use it every week.

    Why do you need a CRO prioritization framework?

    You need a framework because a CRO backlog always grows faster than your team can build and test. After one audit, one round of user interviews, and one look at the analytics, most teams have dozens of ideas. Without a shared way to rank them, the loudest person or the most recent idea wins.

    A framework does three useful things:

    • It forces every idea to be written down with a reason, a page, and an expected effect.
    • It makes tradeoffs visible, such as a big idea that takes six weeks versus a small fix that takes an afternoon.
    • It shortens meetings, because the team debates scores rather than opinions.

    The framework is not a calculator that produces truth. It is a structured conversation. The scores are only as good as the evidence behind them, which is why it helps to start from a proper CRO audit rather than a brainstorm.

    How does the ICE framework work?

    ICE scores each idea from 1 to 10 on Impact, Confidence, and Ease, then averages the three. The model is widely credited to Sean Ellis, who popularized it for growth teams.

    • Impact: how much will this move the main metric if it works?
    • Confidence: how sure are you that it will work, based on evidence?
    • Ease: how little time, money, and risk does it take to ship?

    ICE is fast. A team can score twenty ideas in half an hour. Its weakness is that all three scores are subjective. Two people can give the same idea a 4 and an 8 for confidence, and nothing in the framework settles who is right. Over time, teams also inflate scores for their own ideas.

    How does the PIE framework work?

    PIE scores each idea from 1 to 10 on Potential, Importance, and Ease, then averages them. It was developed by Chris Goward at the agency WiderFunnel, and it is built around pages rather than abstract ideas.

    • Potential: how much room for improvement does this page or element have?
    • Importance: how valuable is the traffic on this page? A cart page with paid traffic matters more than a blog archive.
    • Ease: how hard is the change, technically and politically?

    PIE is good at steering effort toward high value pages, because Importance can be backed by real numbers from analytics, such as sessions and revenue per page. Potential is still a judgment call, and PIE says nothing directly about how strong your evidence is.

    EyeCaptain
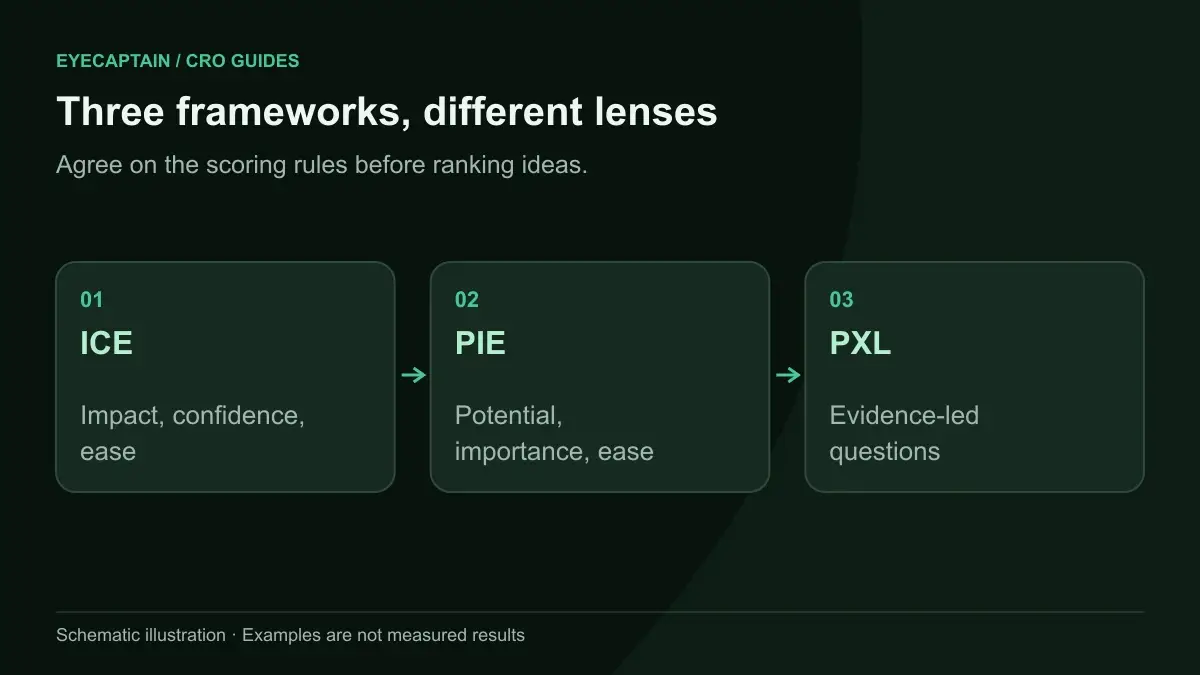
    Three frameworks, different lenses. Agree on the scoring rules before ranking ideas.

    How does the PXL framework work?

    PXL replaces 1 to 10 opinions with a list of yes or no questions, so two people scoring the same idea should land on the same number. It was published by the CXL team as a response to the subjectivity in ICE and PIE.

    Typical PXL questions include:

    • Is the change above the fold?
    • Is it noticeable within five seconds?
    • Does it add or remove an element, rather than just restyle one?
    • Does it run on a high traffic page?
    • Is it backed by user testing, qualitative feedback, heatmap or eye tracking data, or analytics?
    • How easy is it to implement, on a small scale such as 0 to 3?

    The original PXL sheet weights some questions more heavily than others and lets teams add their own criteria, such as "fits this quarter's focus on mobile." PXL rewards ideas with evidence behind them, which is its main strength. It takes longer to set up, and it can undervalue bold ideas that have no data yet.

    ICE vs PIE vs PXL: which framework should you use?

    Use ICE when you need speed and the team is small, PIE when your site has a few clear high value pages, and PXL when you have research data and want less debate. The table compares them side by side.

    CriteriaICEPIEPXL
    Scoring style1 to 10, three factors1 to 10, three factorsYes or no questions plus ease scale
    SubjectivityHighMediumLow
    Rewards evidenceOnly through ConfidenceNot directlyYes, several questions
    Uses page valueIndirectly through ImpactYes, through ImportanceYes, high traffic question
    Setup timeMinutesMinutesAn hour to customize
    Best forSmall teams, early stage sitesSites with a few key pagesTeams with research and a long backlog
    EyeCaptain
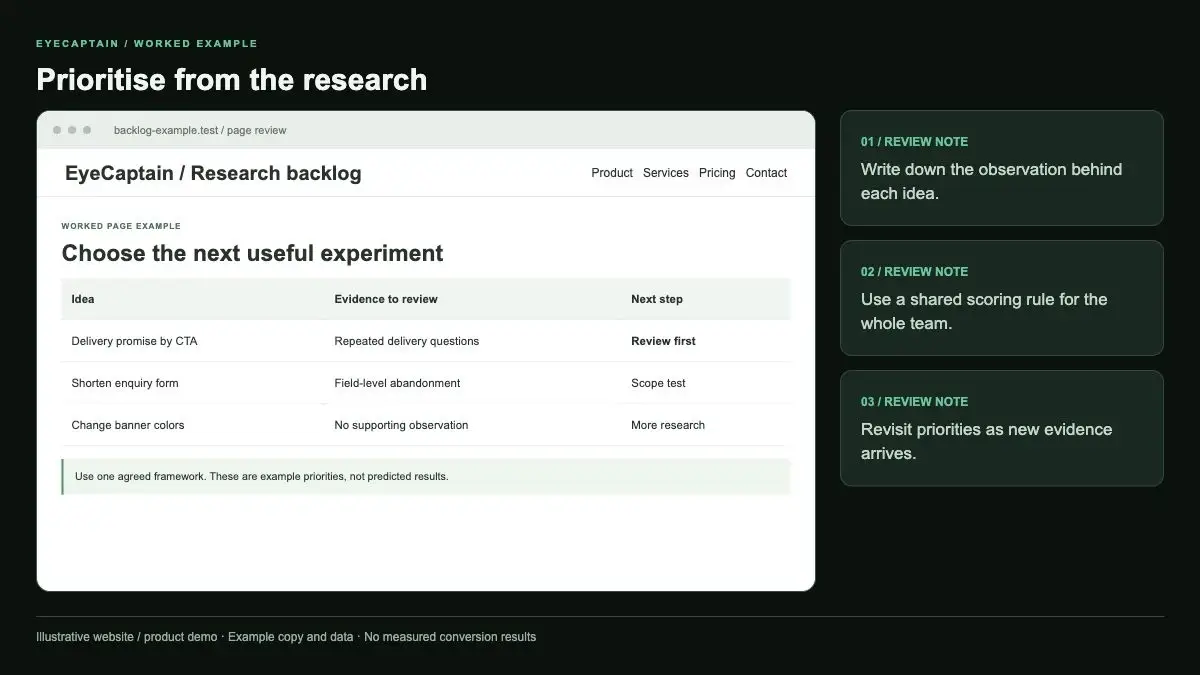
    Prioritise from the research. Write down the observation behind each idea. Use a shared scoring rule for the whole team…

    What does a worked scoring example look like?

    Here is the same backlog of five ideas scored with all three frameworks. The site is a hypothetical online store selling bike accessories, with most revenue coming from product pages and a noticeable drop between cart and checkout.

    1. Idea A: show the delivery date estimate next to the Add to cart button on product pages.
    2. Idea B: replace the homepage hero photo with a brand video.
    3. Idea C: show the shipping cost in the cart instead of at the final checkout step.
    4. Idea D: add a size guide link next to the helmet size selector.
    5. Idea E: rewrite the filter labels on category pages in plain language.

    ICE scores

    Each factor is scored 1 to 10, and the ICE score is the average.

    EyeCaptainEyeCaptain
    97%
    Conversions Booster

    Your visitors leave without converting

    Most websites lose 97% of their traffic without a single conversion. Our AI scans 200+ CRO elements to find exactly where visitors drop off.

    Hero CTA missing

    IdeaImpactConfidenceEaseICE score
    A: Delivery date near CTA7797.7
    B: Homepage video6334.0
    C: Shipping cost in cart8666.7
    D: Helmet size guide6897.7
    E: Filter labels4575.3

    PIE scores

    Importance here uses the analytics: product pages and cart get the most revenue relevant traffic, the homepage less, helmet pages only a slice.

    IdeaPotentialImportanceEasePIE score
    A: Delivery date near CTA7998.3
    B: Homepage video5634.7
    C: Shipping cost in cart8867.3
    D: Helmet size guide7597.0
    E: Filter labels5776.3

    Simplified PXL scores

    To keep the example readable, every yes is worth 1 point and ease is scored 0 to 3. Evidence comes from support emails, a few user tests, a predictive heatmap, and funnel reports.

    IdeaAbove foldNoticeable in 5sAdds or removesHigh trafficEvidence (of 4)Ease (0 to 3)Total
    A: Delivery date near CTA11113310
    B: Homepage video1111015
    C: Shipping cost in cart1111228
    D: Helmet size guide1010237
    E: Filter labels1001226

    What the example shows

    All three frameworks agree on the top and the bottom: idea A goes first and the homepage video goes last. They disagree in the middle. ICE ties A and D, because a size guide feels easy and safe. PIE and PXL both push the shipping cost idea above the size guide, because the cart is a high value page and the funnel data supports it. The homepage video scores well on visibility in PXL but has no evidence at all, which is exactly the kind of idea that wins meetings and loses tests.

    EyeCaptain
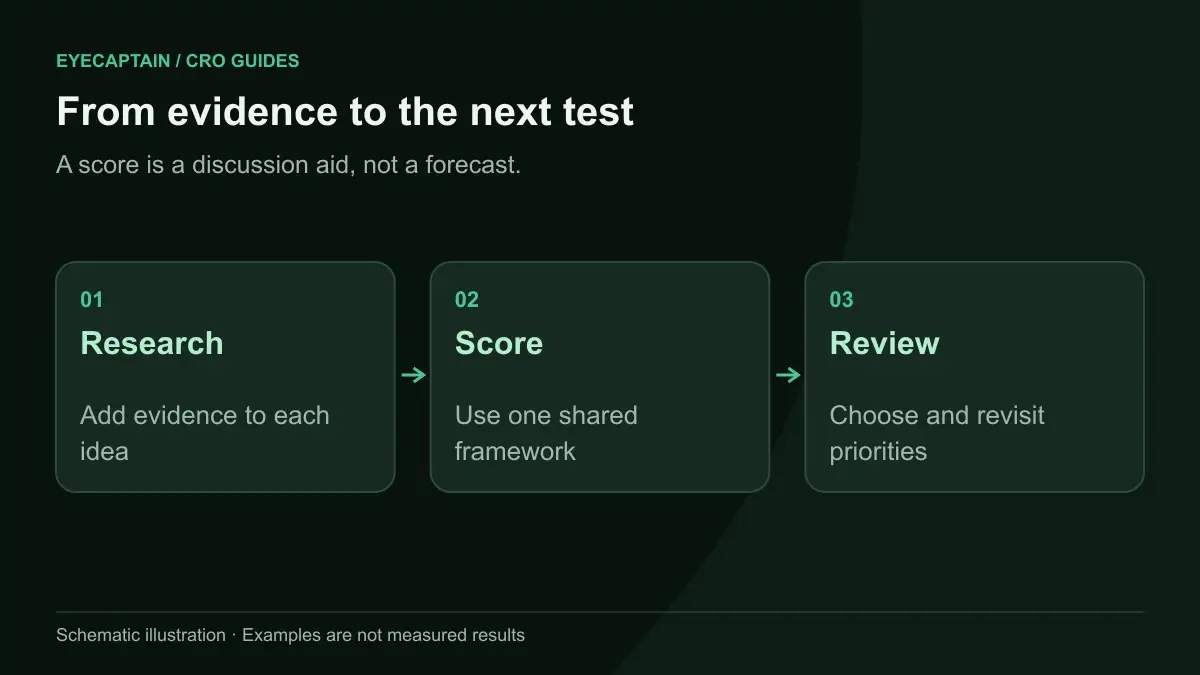
    From evidence to the next test. A score is a discussion aid, not a forecast.

    How do you run prioritization with your team each week?

    Run it as a short, repeatable routine with one owner and one shared sheet. The steps below work for a team of two or twenty.

    1. Collect ideas in one backlog. Each row needs the page, the change, the evidence, and the metric it should move.
    2. Score new ideas before the meeting. The owner pre-scores; others only challenge scores they disagree with.
    3. Sort by score and pick the top few that fit your capacity for the next cycle.
    4. Check for conflicts. Two tests on the same page at the same time can contaminate each other, so stagger them.
    5. Write a hypothesis for each chosen idea before anyone designs or builds it.
    6. Rescore after results come in. A test that wins or loses changes your confidence in related ideas.

    Not every idea needs a test. Clear fixes, such as a broken mobile button or a missing delivery estimate, can ship directly. Save experiments for changes where the outcome is genuinely uncertain. The A/B testing guide covers when a test is worth running.

    Key takeaways

    • ICE is fastest, PIE ties ideas to page value, and PXL rewards evidence with less room for opinion.
    • Frameworks usually agree on the best and worst ideas; the useful debate happens in the middle.
    • Scores are only as good as the evidence, so feed the backlog with audit findings and analytics, not brainstorms.
    • Pick one framework and use it consistently for at least a quarter before changing it.

    If your backlog is empty or full of guesses, a free CRO audit from EyeCaptain gives one page a ranked list of changes you can score with any of these frameworks. For a broader list of things to check, use the CRO checklist.

    EyeCaptain
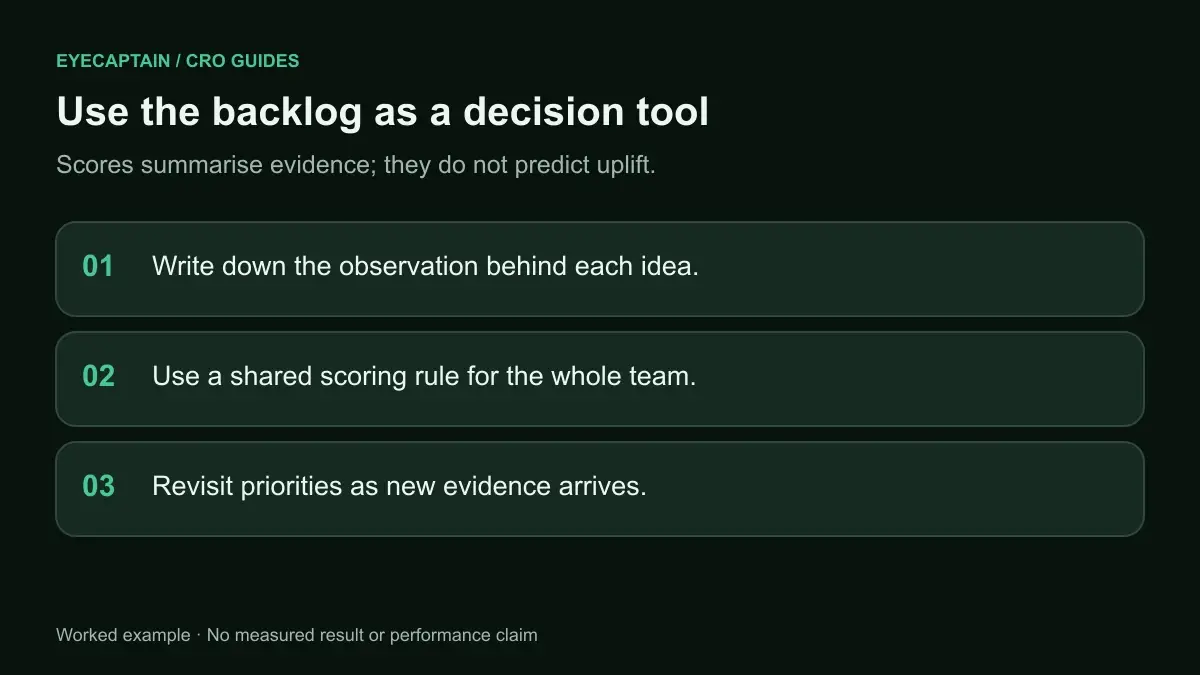
    Use the backlog as a decision tool. Scores summarise evidence; they do not predict uplift.

    Frequently asked questions

    Should ICE scores be averaged or multiplied?

    Both versions are in use. Averaging keeps scores on a familiar 1 to 10 scale and is easy to read. Multiplying punishes ideas that score very low on any single factor, so a high impact idea with almost no confidence drops sharply. Either works, as long as the whole team uses the same method for every idea in the backlog.

    How many test ideas should be in a CRO backlog?

    Enough to fill your next two or three testing cycles with good options, plus a tail of lower priority ideas. A backlog of a few dozen scored ideas is manageable for most teams. If it grows into the hundreds, archive anything that has not moved up in several months, because old ideas are often based on pages that have changed.

    Can you use a prioritization framework without A/B testing?

    Yes. Many sites do not have enough traffic for reliable tests, but they still need to decide what to fix first. Use the same scoring, ship the top ideas as direct changes, and compare before and after metrics carefully, accounting for seasonality and campaigns. The framework is about ordering work, not about the testing method.

    Who should score ideas in a prioritization framework?

    One owner should score every idea first, so the scale stays consistent. Then a small group, typically marketing, design, and development, reviews the scores. Developers are especially useful for Ease, because marketers often underestimate build time. Avoid letting each person score only their own ideas, since that inflates scores.

    Enjoyed this article?

    One short email a week with practical CRO and UX tips

    No spam. Unsubscribe anytime.

    Find what stops your visitors from converting

    EyeCaptain is an AI-powered CRO & UX audit tool that automatically scans your pages, identifies UX issues, and gives you actionable optimization suggestions to increase conversions. Try it for free, no card, no commitment.

    Free CRO Audit
    Share this article
    LinkedIn X

    About the author

    Founder of EyeCaptain. Writes about conversion rate optimization, UX analysis and the neuromarketing behind pages that actually sell.

    More articles by Dimitris Andreadakis