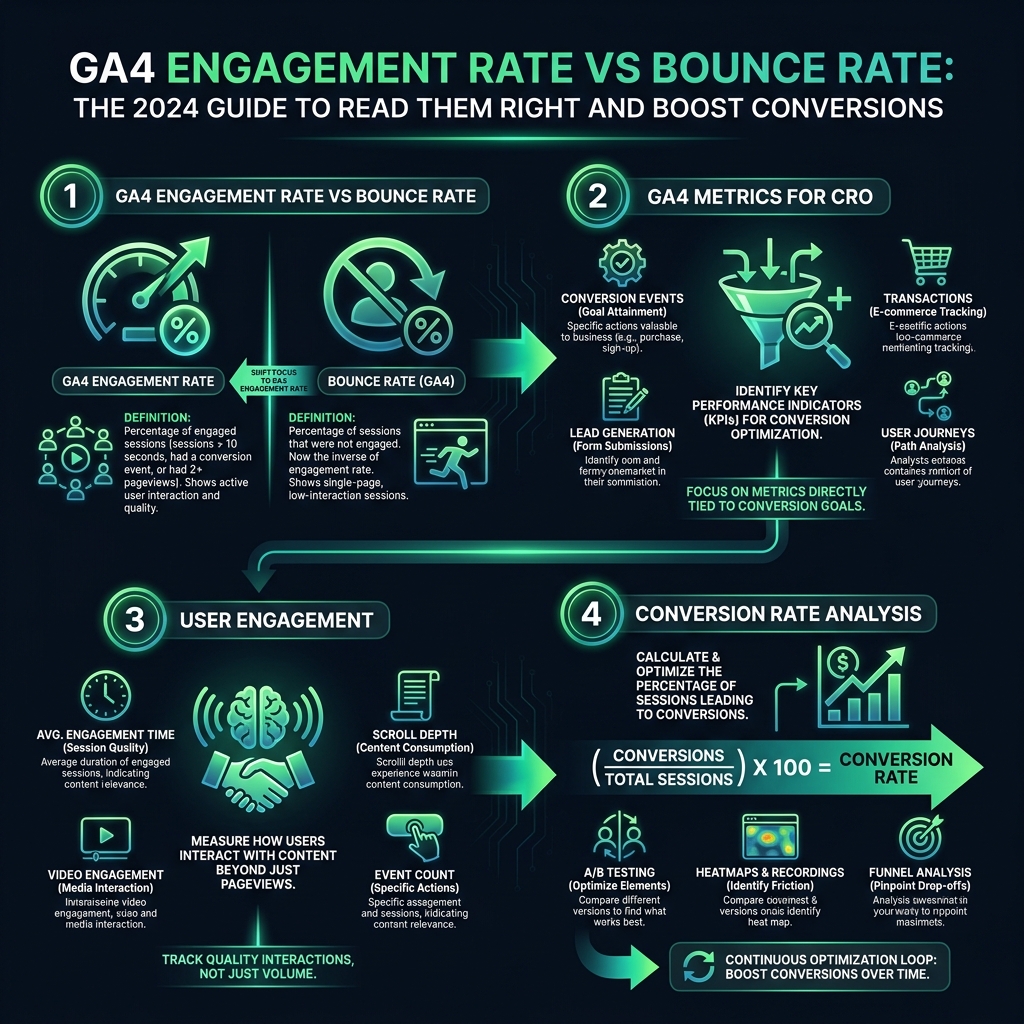

Struggling to understand the critical difference between GA4 engagement rate vs bounce rate? You are not alone. While a high engagement rate in Google Analytics 4 might seem positive, it can be a misleading vanity metric. This guide explains what these key GA4 metrics truly reveal about your user engagement and provides a clear framework for effective conversion rate analysis, helping you move beyond surface-level numbers to drive real business growth.
GA4 Engagement Rate vs Bounce Rate: Understanding the Key Differences
In Google Analytics 4, engagement rate measures the percentage of sessions that were "engaged." A session is counted as engaged if a user completes just one of the following actions:
- Stays on your website for more than 10 seconds.
- Triggers a conversion event.
- Views at least two pages.
This is a fundamental shift from Universal Analytics' bounce rate. The previous bounce rate was a measure of immediate rejection: if a visitor landed on a single page and left without taking any action, they "bounced." It was a direct measure of how many people found your landing page unappealing.
GA4 reverses this logic. Instead of measuring rejection, it measures minimal interaction. While the calculation is a simple inversion (a 30% bounce rate corresponds to a 70% engagement rate), the insight you gain is completely different and requires a new approach to conversion rate analysis.
The Problem with GA4's Definition of User Engagement
The low threshold for an "engaged session" is where the potential for misinterpretation begins. A user can land on your product page, scroll for 11 seconds without clicking anything, and then leave. In GA4, this is considered a success - an engaged user. Your engagement rate improves, but did that visitor get any closer to making a purchase? No.
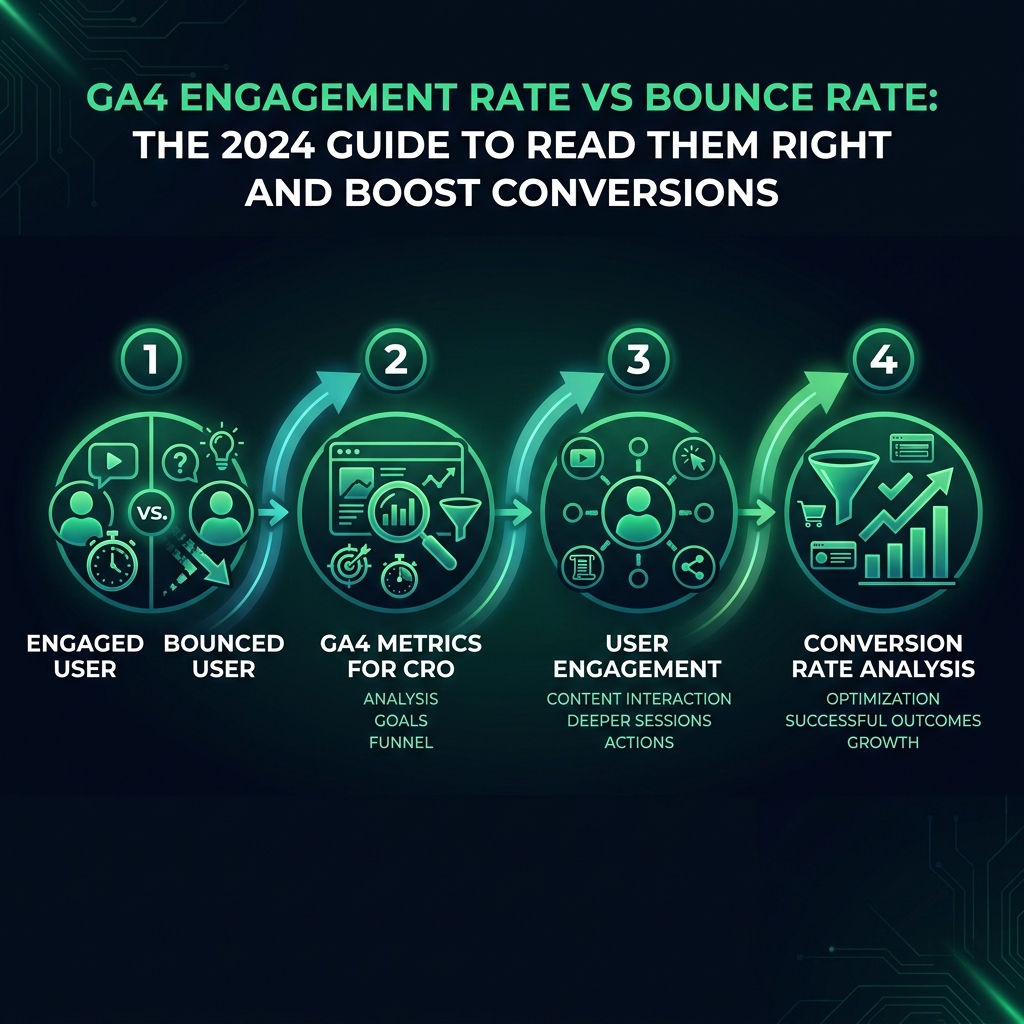

A 2023 study from the Baymard Institute found that nearly 70% of all online shopping carts are abandoned globally. These users are clearly "engaged" by most standards, yet they do not convert. Your GA4 engagement rate will not show you this critical gap between interest and action.
This highlights why relying solely on this single metric is a mistake. To truly understand performance, you need to analyze the right GA4 metrics for CRO (Conversion Rate Optimization).
How to Analyze GA4 Metrics for CRO and Deeper Insights
Engagement rate becomes useful only when you stop treating it as a final result. Instead, view it as a diagnostic tool for understanding different segments of user behavior.
If you have a high engagement rate but low conversions, it signals that your content is attracting interest, but your conversion process may be flawed. Visitors are spending time on your site, but something prevents them from taking the final step. This is likely a conversion pathway problem, not a traffic quality problem.
Conversely, a low engagement rate but good conversions suggests your site is effective for users who are already decided. They arrive, find what they need, and purchase efficiently. The issue here is that you are failing to capture and convince any undecided visitors.
Remember, research from the Nielsen Norman Group shows users often decide whether to stay on a site in under 10 seconds - the exact threshold GA4 uses. If your engagement rate is low, it is a strong indicator that your initial value proposition is failing. However, GA4 cannot tell you why users are engaged. A high rate could mean they are happily browsing or that they are lost and clicking around in confusion. This is why you must segment your data by traffic source, landing page, and device to get a clearer picture of user engagement.
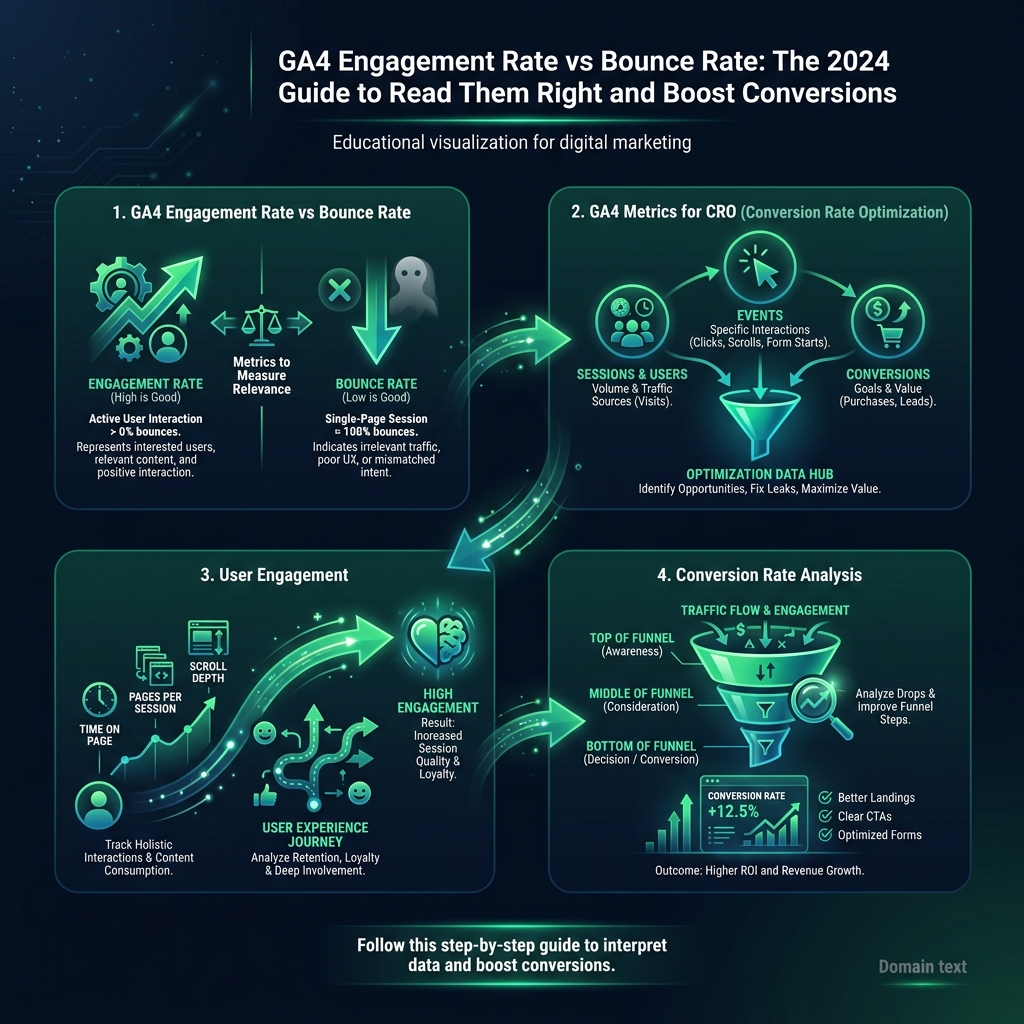
The Best GA4 Metrics for Conversion Rate Analysis
To get a metric that actually correlates with business goals, you need to combine data points. The most powerful combination in GA4 is: Engagement Rate + Average Engagement Time.