
Struggling with high cart abandonment and a low conversion rate? A powerful GA4 funnel exploration report is the key to effective checkout optimization and reclaiming lost revenue. This guide explains how to perform a detailed conversion rate analysis, leveraging crucial user behavior analytics to pinpoint exactly where customers are leaving your e-commerce store and why.
Understanding Checkout Drop-Offs with User Behavior Analytics
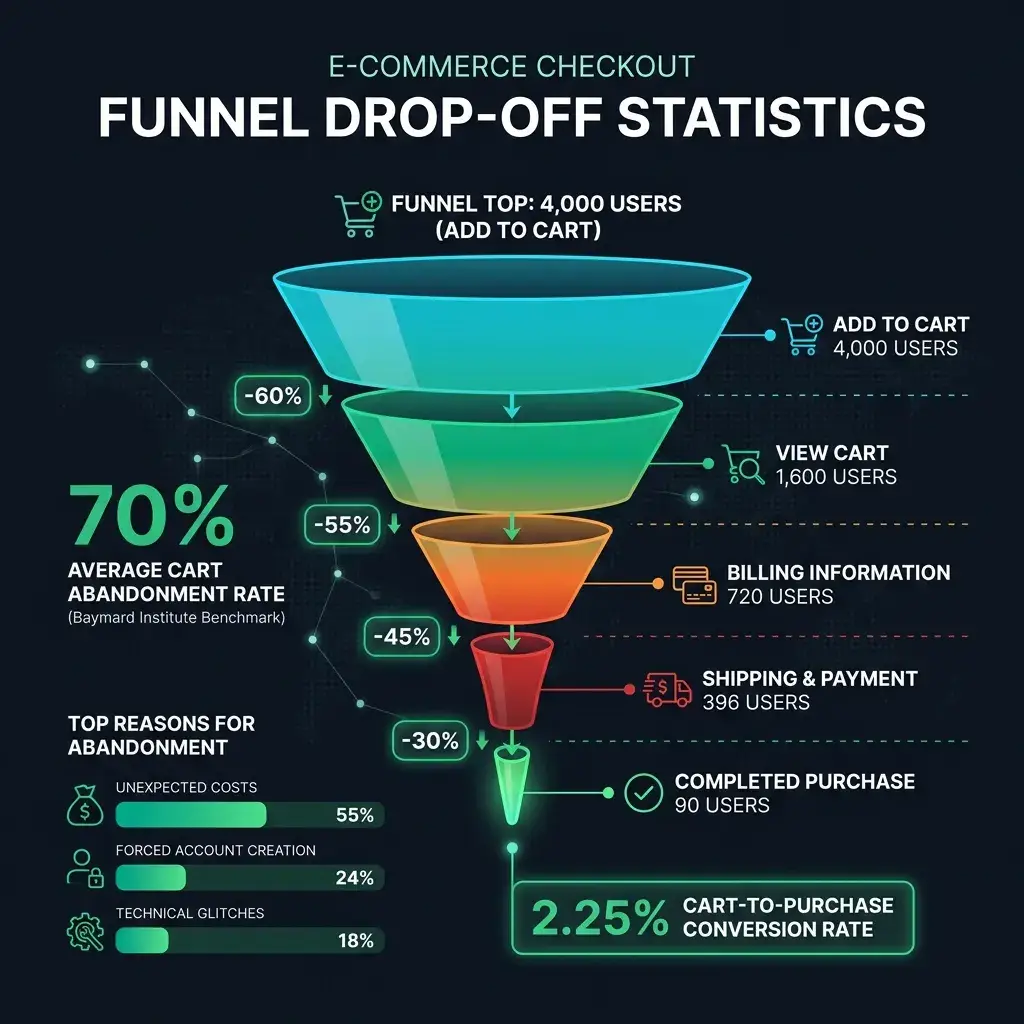
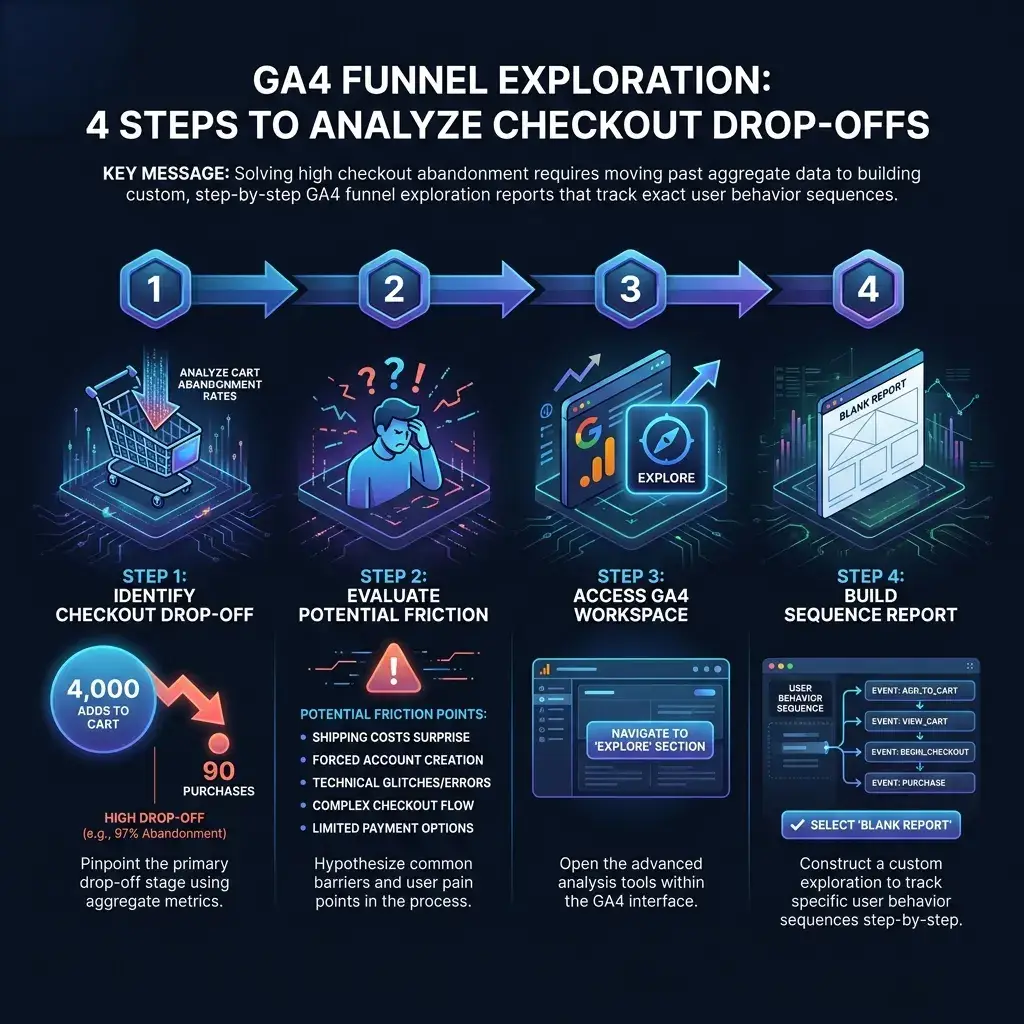
An e-commerce owner recently shared their analytics: over 4,000 users added a product to their cart, but only 90 completed the purchase. If this scenario feels familiar, you are not alone. This massive drop-off is a common challenge, and the key to solving it lies in understanding the user journey through your checkout process.
The Baymard Institute finds that the average cart abandonment rate is nearly 70%. That means seven out of every ten potential customers who show clear intent to buy leave before paying.
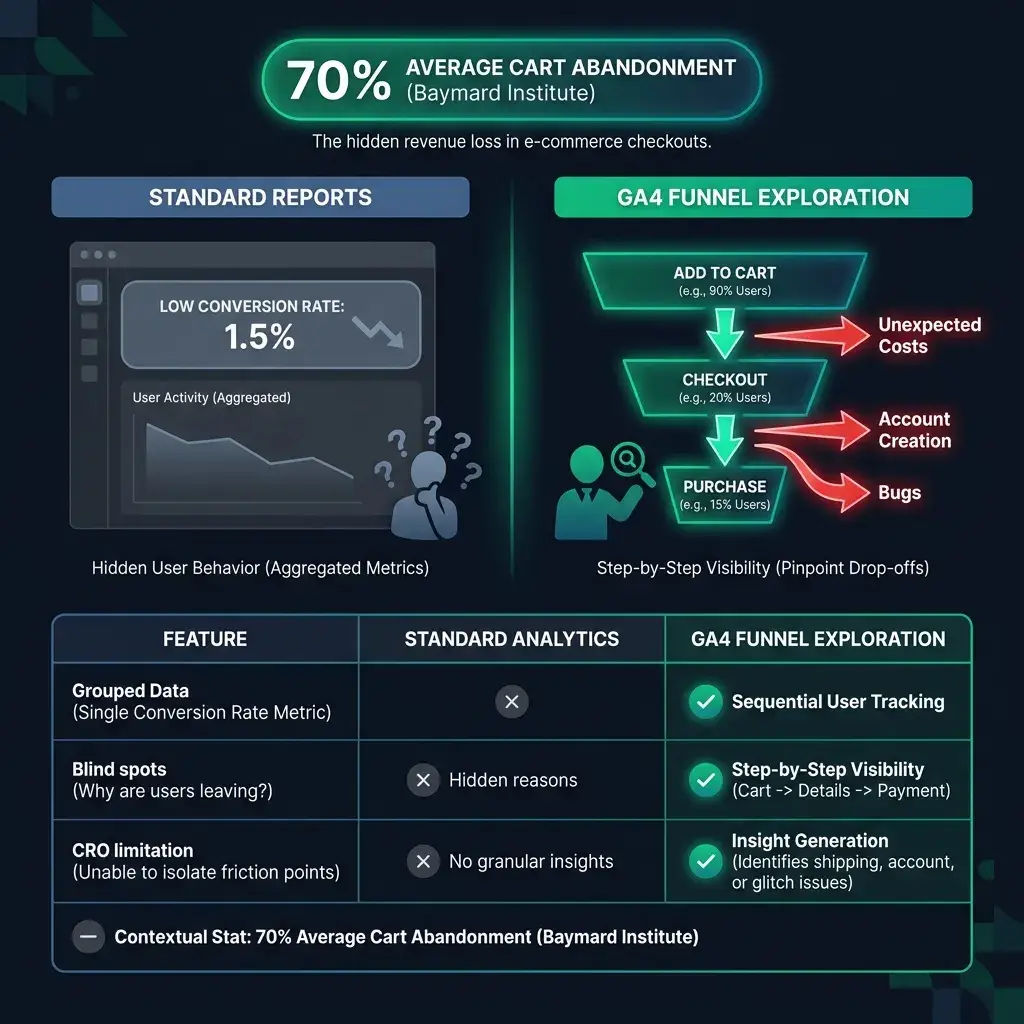
When a shopper gets frustrated and leaves, they rarely explain why. Perhaps they encountered unexpected shipping costs or import duties, were forced to create an account, or ran into a technical glitch. They simply close the browser tab, leaving you with a low conversion rate and a difficult puzzle. Standard analytics reports often group this complex behavior into a single number, making true ecommerce CRO (Conversion Rate Optimization) nearly impossible.
How to Build a GA4 Funnel Exploration Report for Checkout Optimization
The only way to see where shoppers disappear is by building a proper GA4 funnel exploration report. To get started, navigate to the Explore section in your Google Analytics 4 account and select a blank report. This powerful workspace allows you to track specific user sequences rather than just viewing aggregated page data.

Configuring Your Funnel Report
In the report settings, change the visualization type to "Funnel exploration". You will then have a choice between an "Open" or "Closed" funnel. For checkout optimization, you should almost always choose a closed funnel. This ensures you are only analyzing users who follow the specific, linear path you define, from adding an item to their cart to completing the purchase.
Setting Up Custom Funnel Steps
Defining granular steps is crucial for an effective conversion rate analysis. Instead of one generic "checkout" event, break the process down into discrete actions to see exactly where the friction occurs.
- Step 1: Add to Cart (event: add_to_cart) - This is your baseline, capturing everyone who showed initial purchase intent.
- Step 2: Begin Checkout (event: begin_checkout) - This vital step separates users who are ready to buy from those just using the cart as a temporary wishlist.
- Step 3: Add Shipping Info (event: add_shipping_info) - Tracking this helps identify issues with address forms, shipping cost calculations, or lack of international shipping options.
- Step 4: Add Payment Info (event: add_payment_info) - This isolates problems related to payment gateways, card security, or a lack of locally preferred payment methods.
- Step 5: Purchase (event: purchase) - The final step, showing who successfully completed the transaction.
Once saved, GA4 will generate a bar chart visualizing the user drop-off between each of these critical steps, giving you a clear map of your conversion funnel's health.
Actionable Conversion Rate Analysis for Global E-commerce
Your new funnel report is more than just a chart; it is a diagnostic tool for your ecommerce CRO strategy. The real power comes from segmenting this data to understand not just where users drop off, but who is dropping off and why. This is the essence of modern user behavior analytics.