
Struggling to understand why visitors leave your site without converting? While traditional analytics provide numbers, they don't reveal the "why" behind user actions. This is where user behavior analytics comes in, offering a powerful way to conduct a true conversion rate analysis by showing you exactly what real people do on your website. By moving beyond basic metrics, you can uncover the friction points that are costing you sales and learn how to optimize your user experience for better results.
This powerful approach lets you watch what real users are doing on your website. You can see every click, every scroll, every frustrated mouse movement, and the exact moment a potential customer decides to leave. It's the story behind the data.
User Behavior Analytics vs. Traditional Web Analytics
Let's clarify the difference. A platform like Google Analytics might tell you that 47% of users abandoned a product page. That's a what, not a why. A good website analysis tool shows you the why. You can watch a session recording and see a user scroll halfway down, hover their mouse over the "Add to Cart" button, and then hesitate. They scroll back up, click the product image again, and then leave. That's not a traffic problem; it's a user experience or trust problem.
Think of it this way: traditional web analytics is like reading a movie's final review - it tells you the outcome. User behavior analytics is like watching the entire movie. It records the complete user session, showing you the plot, the character's struggles, and the exact moments that led to the final result, giving you crucial context behind the numbers.
The Baymard Institute found that nearly 70% of shopping cart abandonment is caused by a clunky or confusing checkout process. These are experience issues you can only fix if you can see them happen.
This deeper understanding starts with two key features found in any modern website analysis tool.
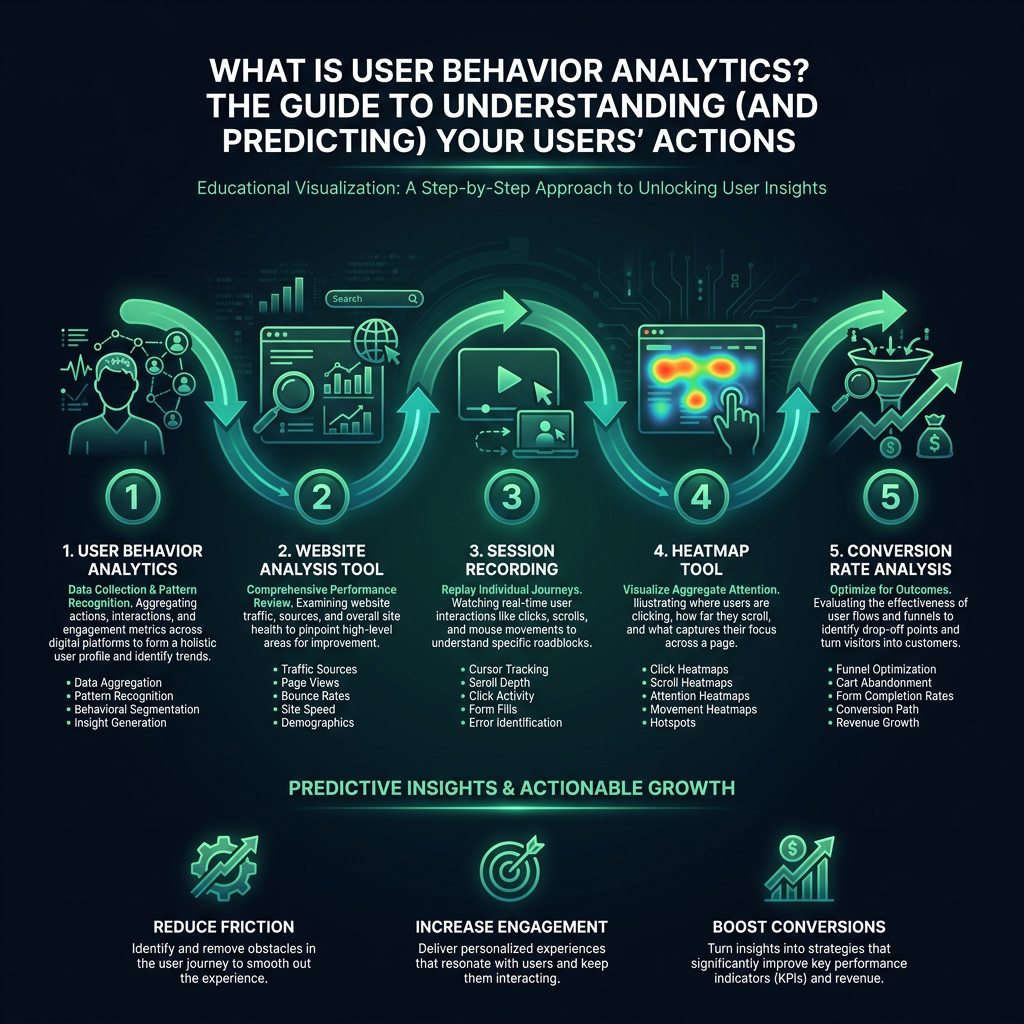
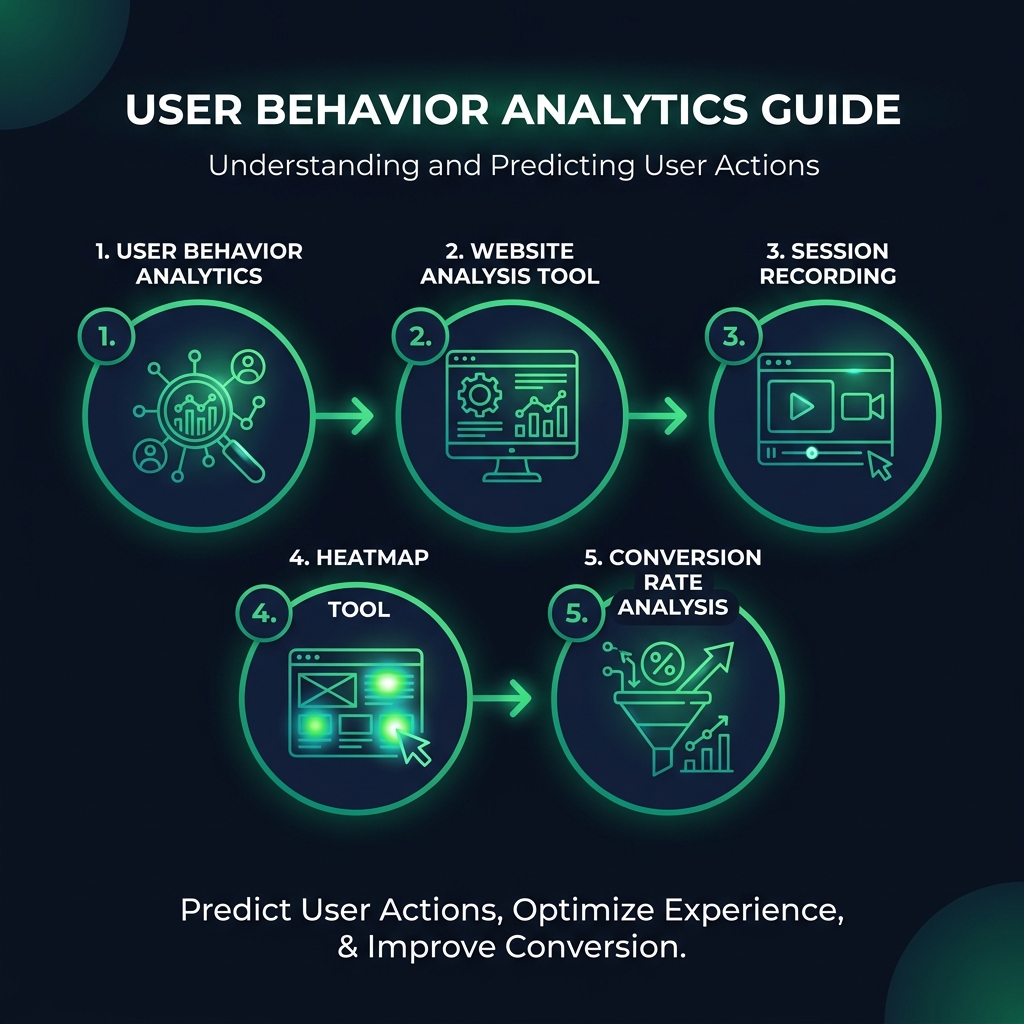
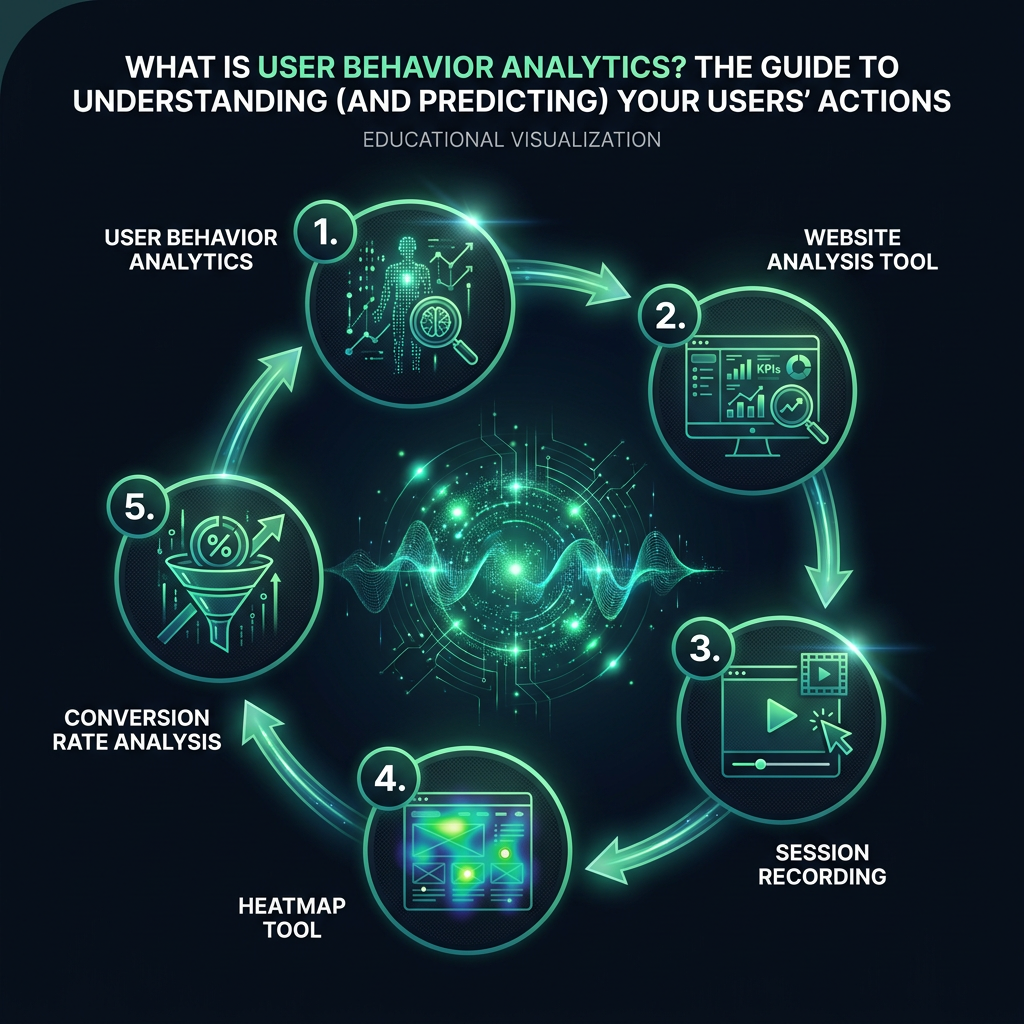
Session Recordings: See Your Site Through Your Users' Eyes
A session recording, or session replay, captures everything a user does, from mouse movements and clicks to scrolling and form interactions. It's like looking over their shoulder as they navigate your site. Suddenly, you can spot the button that doesn't look clickable, the confusing headline that causes hesitation, or the broken element that stops a purchase in its tracks.
Heatmaps: Visualize Aggregate User Behavior
A heatmap tool aggregates data from thousands of sessions into a simple, color-coded visual. Click maps show where people are actually clicking, while scroll maps reveal how far down your page the average visitor reads. Move maps, which track cursor movement, are a surprisingly accurate indicator of where users are focusing their attention. These visual reports make it easy to spot trends and problem areas at a glance.
Using Session Recordings and Heatmaps for Conversion Rate Analysis
The real value isn't just watching random sessions; it's in finding the patterns that separate buyers from browsers. A focused conversion rate analysis becomes simple when you compare two key user groups: those who converted and those who abandoned their journey.
Watch ten session recordings from each group. The behavioral differences will be immediately obvious.
You'll notice that converting users move with purpose. They scroll methodically, read important sections like product specifications or reviews, and find what they need efficiently. Non-converters, however, often have chaotic sessions. They may jump around the page, click on non-interactive elements (a sign of frustration), or re-read the same section repeatedly, indicating confusion. These friction points are your roadmap for optimization.