Infographic για digital marketing - οπτικοποίηση εννοιών heatmap analysis, website heatmap, how to read a heatmap
    eyecaptain.io

    Website Heatmap Analysis: Decoding User Behavior Secrets

    Stop guessing how users interact with your site. Learn surgical heatmap analysis techniques that transform visitor data into actionable conversion strategies.

    EyeCaptain

    Dimitris

    27 February 2026

    4 min read
    437 views
    heatmap analysiswebsite heatmaphow to read a heatmapclick mapscroll map

    Understanding how users interact with your website is essential for improving performance and increasing conversions. A website heatmap provides an immediate visual guide to user behavior, and learning how to read a heatmap is a valuable skill for any digital professional. This guide to heatmap analysis will show you how to interpret user actions, move beyond assumptions, and start making data-driven decisions to enhance your user experience.

    What is Heatmap Analysis? Decoding User Behavior

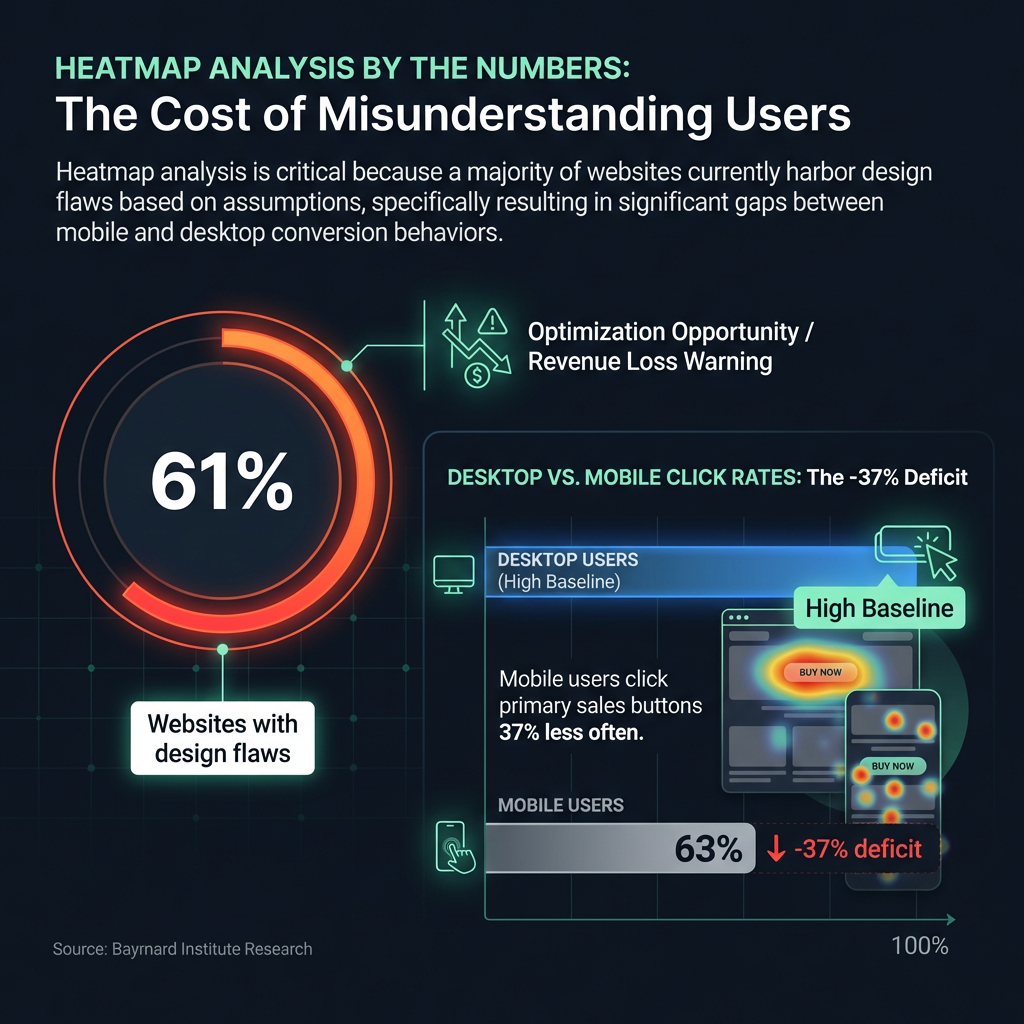
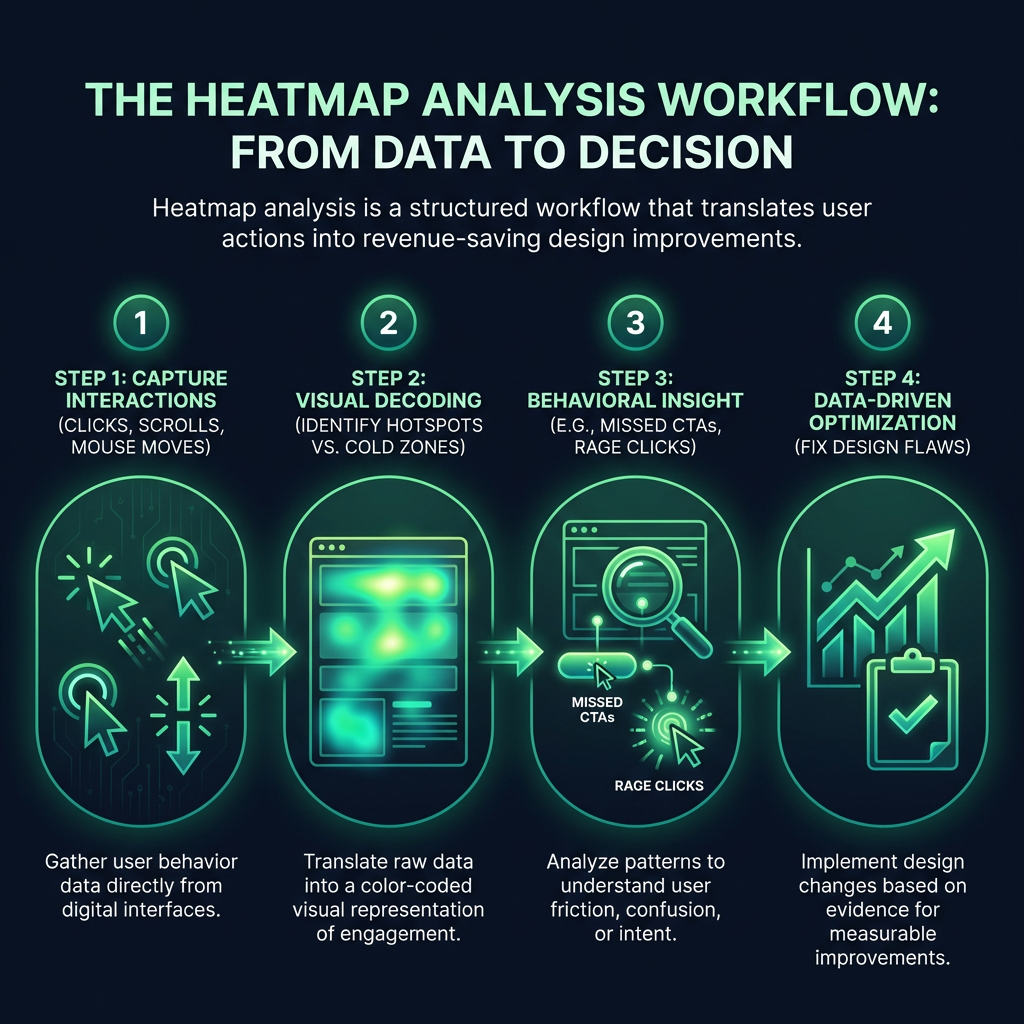
    At its core, heatmap analysis is the process of interpreting visual data that shows where users click, move their mouse, and scroll on your website pages. It is much more than a colorful report; it is a powerful method for understanding your users' thought processes. Research from the global usability firm Baymard Institute found that 61% of websites have design flaws resulting from a misunderstanding of user behavior, leading to significant losses in potential revenue. This suggests a majority of websites may have optimization opportunities they are not aware of.

    Click Maps: Visualizing User Clicks

    A click map offers direct, unfiltered evidence of what captures your audience's attention. It reveals the effectiveness of your design by showing precisely where users click. A thorough analysis of a click map can answer critical questions:

    Συγκριτικό γράφημα click map που δείχνει τη διαφορά συμπεριφοράς χρηστών μεταξύ υπολογιστή και κινητού. Η αριστερή πλευρά απεικονίζει ένα desktop heatmap με έντονη δραστηριότητα (θερμά χρώματα) στο κουμπί αγοράς, ενώ η δεξιά πλευρά δείχνει το ίδιο κουμπί σε mobile με μειωμένη δραστηριότητα (ψυχρά χρώματα), τονίζοντας την ανάγκη για βελτιστοποίηση UX στις φορητές συσκευές.
    EyeCaptain
    eyecaptain.io
    • Is your primary call-to-action button, such as "Buy Now," being overlooked?
    • Are users frequently clicking on non-interactive elements like images or text?
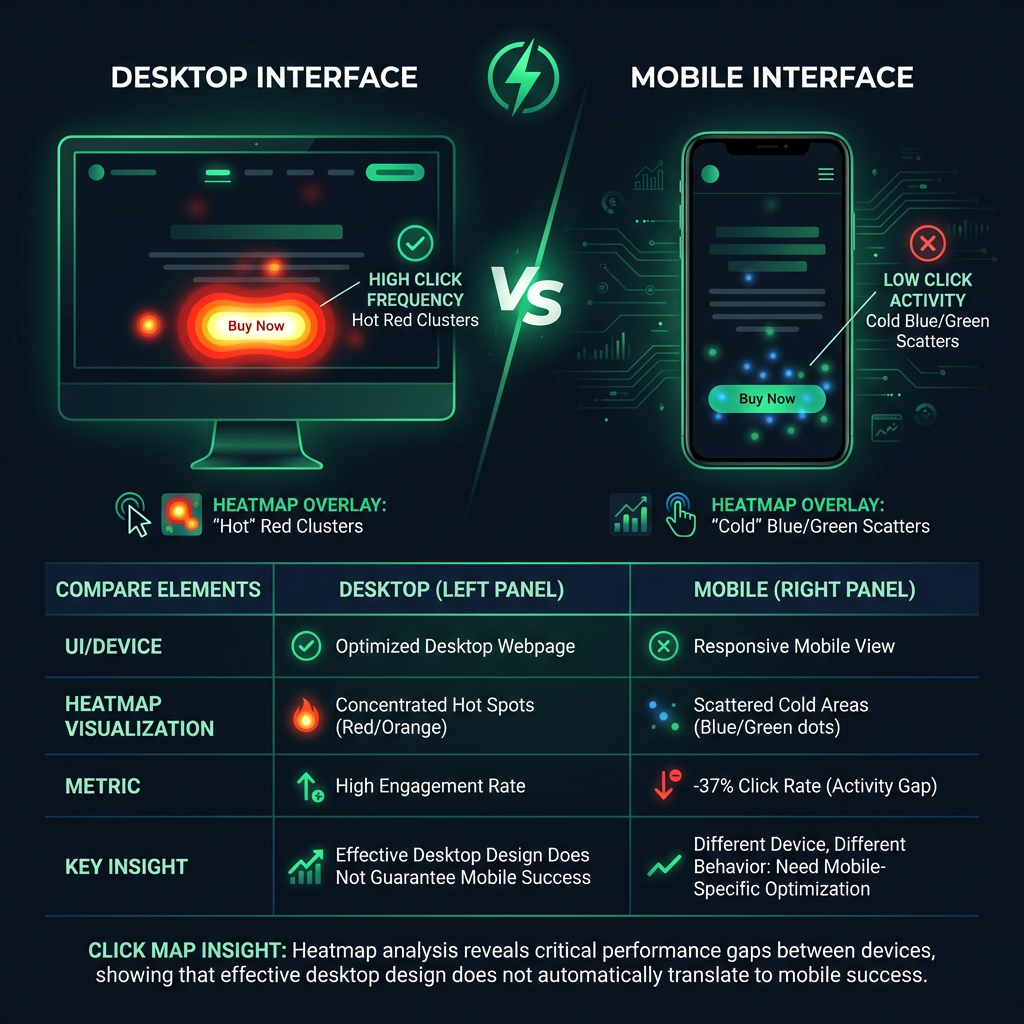
    • How does click behavior differ between desktop and mobile users?

    For example, an analysis of an international e-commerce site revealed that mobile users clicked on primary sales buttons 37% less often than desktop users. This type of insight, discovered through a detailed click map, is fundamental for mobile-first optimization strategies.

    How to Read a Heatmap: Understanding Scroll Maps

    A scroll map illustrates a key part of the user journey: how far down a page visitors are willing to scroll. For years, studies from usability experts like the Nielsen Norman Group have shown that most user attention is concentrated on the content visible without scrolling, often called the area "above the fold." A scroll map visually confirms this by using color gradients to show the most and least viewed sections of a page.

    Do you have valuable content and compelling calls-to-action at the bottom of your page? A scroll map will quickly tell you if users ever see them.

    Σχεδιάγραμμα της διαδικασίας ανάλυσης χαρτών θερμότητας (heatmaps) σε τέσσερα βήματα. Δείχνει τη ροή από την καταγραφή των αλληλεπιδράσεων του χρήστη (κλικ, κύλιση), στην οπτική αποκωδικοποίηση των δεδομένων, την εξαγωγή συμπερασμάτων για τη συμπεριφορά και τελικά τη βελτιστοποίηση της ιστοσελίδας (CRO) βάσει δεδομένων.
    EyeCaptain
    eyecaptain.io

    Advanced Scroll Map Interpretation

    Professional heatmap analysis goes a step further. It is not just about how far users scroll, but also how quickly they scroll. Are they moving rapidly past an entire section, or are they slowing down to read specific content? These moments of hesitation indicate what truly captures their attention and what is ignored, giving you clear direction on where to place your most important information for maximum impact.

    EyeCaptainEyeCaptain
    97%
    Conversions Booster

    Your visitors leave without converting

    Most websites lose 97% of their traffic without a single conversion. Our AI scans 200+ CRO elements to find exactly where visitors drop off.

    Hero CTA missing

    Combining Heatmap Data for Deeper Insights

    A common mistake in user behavior analysis is examining only one type of heatmap. Relying on a single view can be misleading. The complete story emerges when you layer a click map with a scroll map and mouse movement tracking (move maps).

    By combining different heatmap reports, a software company discovered that users were repeatedly clicking a line of text they incorrectly believed was a button. Resolving this single point of user friction, identified through comprehensive heatmap analysis, increased their conversions by 22%.

    This is a perfect example of how a frustrating user experience, often invisible in standard analytics, is clearly revealed when you combine different types of website heatmap data.

    Στατιστικό γράφημα (infographic) που παρουσιάζει δεδομένα ανάλυσης χαρτών θερμότητας (heatmaps). Το γράφημα δείχνει ότι το 61% των ιστοσελίδων έχουν σχεδιαστικά λάθη που μειώνουν τα έσοδα, σύμφωνα με το Baymard Institute. Επίσης, περιλαμβάνει συγκριτικό ραβδόγραμμα που αποδεικνύει ότι οι χρήστες κινητών κάνουν κλικ στα κουμπιά αγοράς 37% λιγότερο συχνά σε σχέση με τους χρήστες υπολογιστών.
    EyeCaptain
    eyecaptain.io

    The Psychology Behind Website Heatmap Data

    A website heatmap provides more than technical data; it offers a direct view into user psychology and attention. Understanding the color-coding is fundamental to learning how to read a heatmap:

    • Hot Spots (Red, Orange, Yellow): These bright areas on your click map or move map indicate high levels of interaction and attention. This is where users are focused, interested, and engaged.
    • Cold Spots (Green, Blue): These cool-colored areas represent sections with low user engagement. This is where content is often overlooked or ignored.

    When you start to see a website heatmap not just as a technical tool but as a study of human behavior, your perspective on web optimization will change. If you are not analyzing this data, you are making assumptions. Every decision based on an assumption is a missed opportunity for growth and revenue.

    Enjoyed this article?

    Join 1,500+ professionals getting weekly CRO & UX tips

    🎁 Bonus: Weekly CRO insights + exclusive resources

    No spam. Unsubscribe anytime.

    🚀 Boost Your Conversion Rate with EyeCaptain

    EyeCaptain is an AI-powered CRO & UX analysis tool that automatically scans your pages, identifies UX issues, and gives you actionable optimization suggestions to increase conversions. Try it for free, no card, no commitment.

    Free CRO Audit

    Did you find this helpful?

    Share it with someone who might find it useful.

    Be the first to learn CRO secrets

    Actionable tips, case studies & early access to new AI tools. Weekly in your inbox.

    1,200+ marketers trust us

    Cookie Settings

    We use cookies to improve your experience.