Infographic για digital marketing - οπτικοποίηση εννοιών user behavior analytics, session recording, click tracking
    eyecaptain.io

    User Behavior Analytics: Revenue Multiplier 2026

    Decoding User Behavior Analytics for 2026. Learn how to transform raw visitor data into a revenue multiplier without invasive tracking methods.

    EyeCaptain

    Dimitris

    03 March 2026

    4 min read
    343 views
    user behavior analytics 2026 guideecommerce visitor tracking tools 2026how to analyze website behavior

    Understanding User Behavior: What Are Your Visitors Really Doing?

    Do you truly understand what happens when someone visits your website? Beyond traffic numbers and conversion rates, user behavior analytics provides a direct view of your audience's actual experience, revealing the crucial gap between what you assume they're doing and their real actions. This insight is essential for diagnosing issues and unlocking your site's true potential on a global scale.

    Why You Might Be Losing Conversions (And How to Find Out)

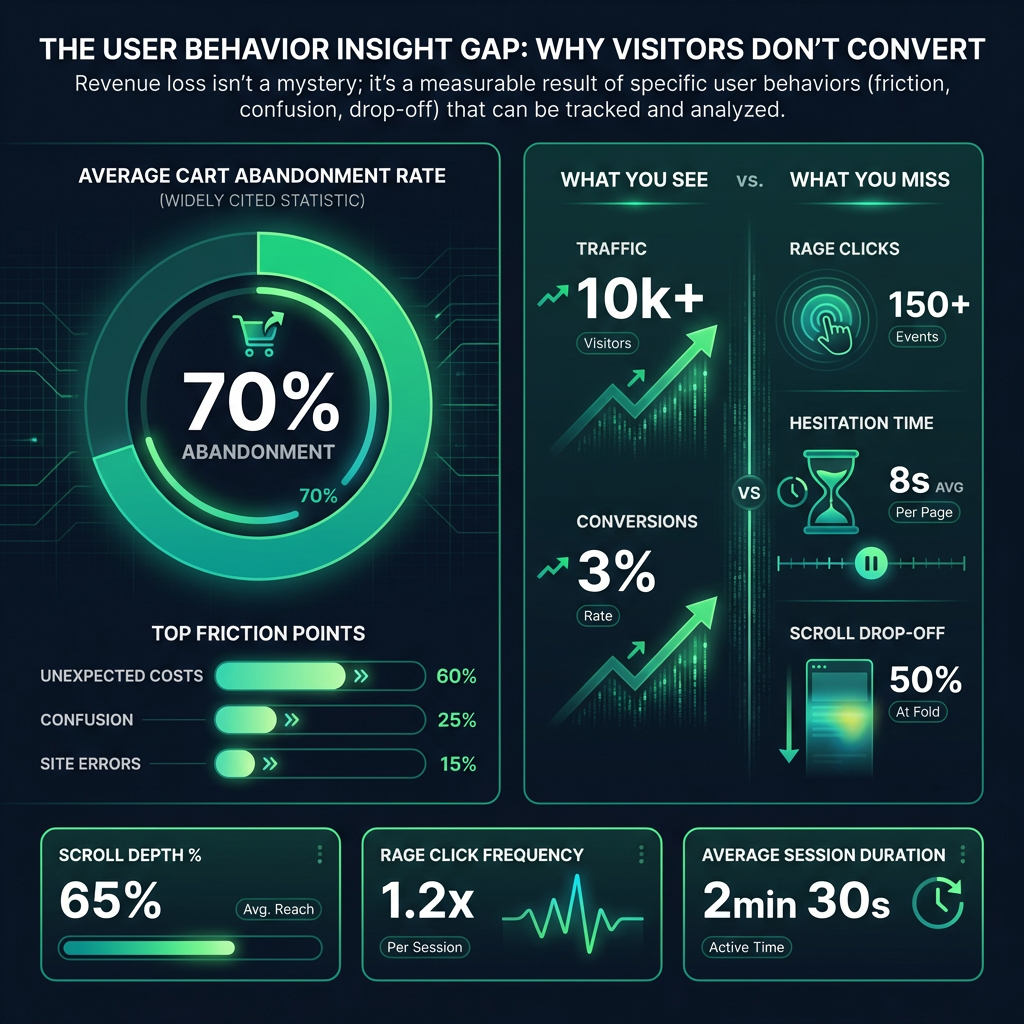
    Many businesses operate without a clear picture of why visitors leave without converting. The data often paints a startling picture of user frustration and confusion. This is a global challenge affecting online businesses of all sizes, particularly in e-commerce:

    A widely cited statistic shows that a high percentage of online shopping carts are abandoned before purchase. Most companies have no idea why these potential customers leave at the final step.

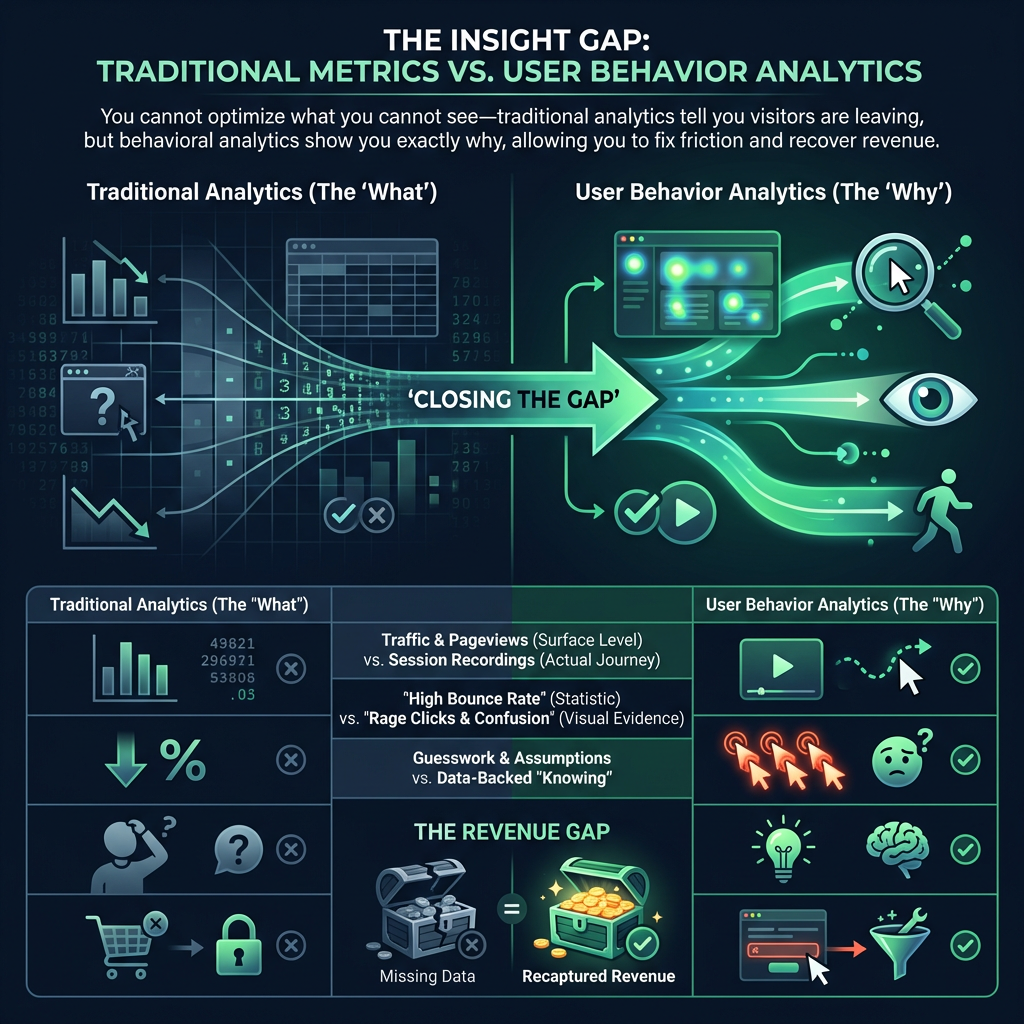
    This isn't just a statistic; it's lost revenue. The key is to move from guessing to knowing. By analyzing the user journey, you can pinpoint the exact moments of friction that cause visitors to drop off, turning a business challenge into your biggest opportunity for growth.

    Συγκριτικό γράφημα (infographic) που αντιπαραθέτει τα παραδοσιακά web analytics με την ανάλυση συμπεριφοράς (user behavior analytics). Η αριστερή πλευρά απεικονίζει ποσοτικά δεδομένα, όπως αριθμούς επισκεψιμότητας και υποθέσεις, ενώ η δεξιά πλευρά δείχνει ποιοτικά δεδομένα, όπως χάρτες θερμότητας (heatmaps), click tracking και εγγραφές συνεδριών. Το γράφημα εξηγεί πώς η κατανόηση της πραγματικής εμπειρίας του χρήστη βοηθά στον εντοπισμό προβλημάτων πλοήγησης και στη μείωση της εγκατάλειψης καλαθιού.
    EyeCaptain
    eyecaptain.io

    What is User Behavior Analytics?

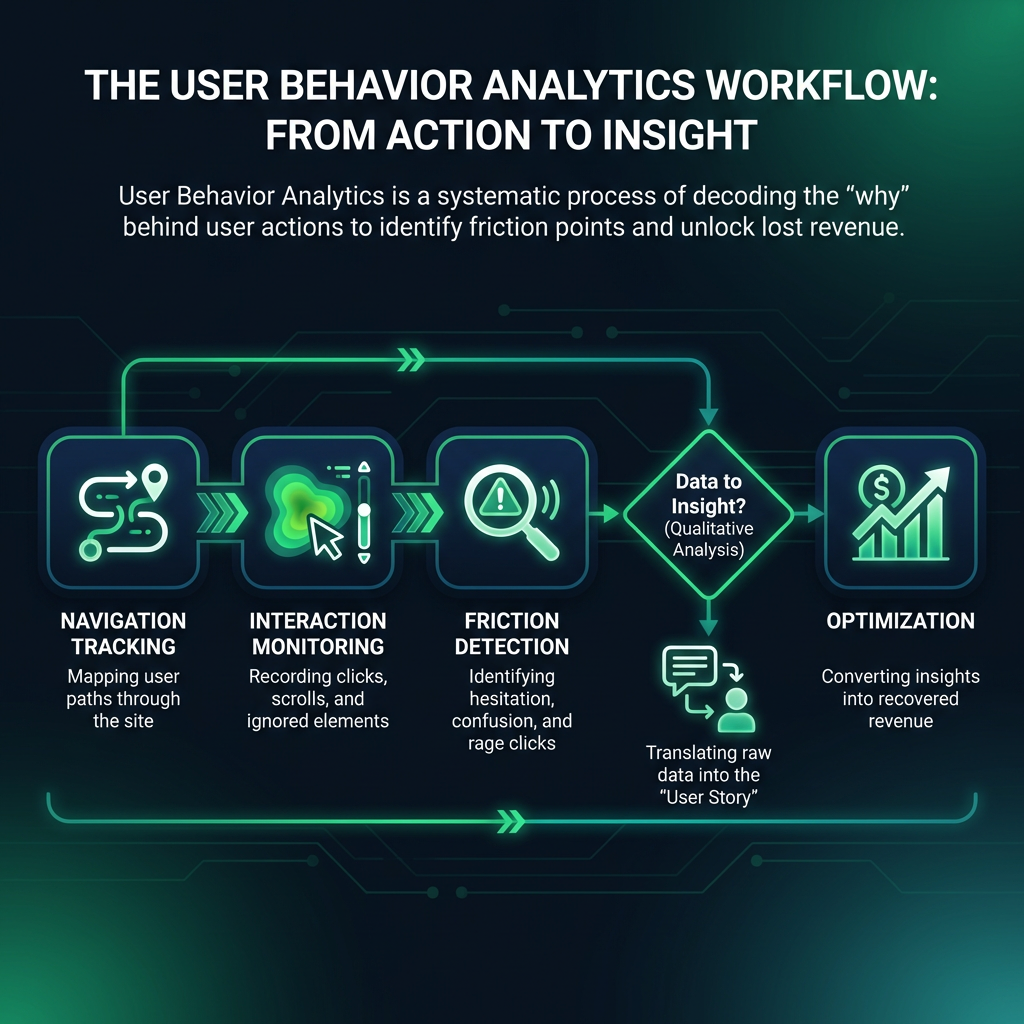
    At its core, user behavior analytics is the process of tracking, collecting, and analyzing how real people navigate and interact with your website or application. It goes beyond traditional metrics to capture the qualitative story behind the numbers. This digital experience insight allows you to see:

    • The paths users take through your site.
    • How far they scroll down important pages.
    • Which elements they click on, ignore, or struggle with.
    • Where they hesitate or show signs of confusion.

    This granular behavioral data tells the complete story of the user journey, from arrival to exit, no matter where your audience is located.

    See Your Site Through Your Users' Eyes with Session Recording

    One of the most powerful features of modern analytics is session recording. Also known as session replay, this technology provides a video-like playback of an individual user's visit. Imagine watching a recording of a customer failing to complete your checkout process. With user session playback, you can see the exact moment they get stuck, the confusing form field they can't figure out, or the broken button that stops them completely. This kind of visual evidence is invaluable for user experience (UX) and conversion optimization.

    Διάγραμμα ροής που απεικονίζει τη διαδικασία ανάλυσης της συμπεριφοράς χρηστών (User Behavior Analytics). Τα 5 βήματα περιλαμβάνουν: την καταγραφή της πλοήγησης, την παρακολούθηση αλληλεπιδράσεων (κλικ/scroll), τον εντοπισμό σημείων τριβής και δισταγμού, την ποιοτική ανάλυση και τη βελτιστοποίηση για ανάκτηση εσόδων.
    EyeCaptain
    eyecaptain.io

    Decode User Intent with Advanced Click Tracking

    Modern click tracking offers far more than a simple heatmap of popular spots. Today's behavioral analytics tools capture nuanced interactions that reveal deep insights into user experience. For example, they can identify:

    EyeCaptainEyeCaptain
    3sec
    Conversions Booster

    Users decide in 3 seconds — are you losing them?

    If your page doesn't hook visitors instantly, they're gone. Get a full breakdown of what's causing friction above the fold.

    Slow LCP detected

    • Rage Clicks: When a frustrated user clicks repeatedly on the same spot because an element is not working as expected.
    • Dead Clicks: When a user clicks on a non-interactive element, like an image they mistake for a button.

    These are not just data points; they are clear signals of user frustration and usability problems that need to be addressed.

    Choosing the Right Behavioral Analytics Tools

    To gather these powerful insights, you need the right software. Behavioral analytics tools are platforms designed specifically to capture and visualize user interactions. These comprehensive solutions bundle essential features like session recording, click tracking, heatmaps, and scroll maps into a single dashboard. By implementing one of these UX tools, you can stop making assumptions and start making data-driven decisions to improve your website's performance and global user satisfaction.

    Στατιστικό infographic τύπου ταμπλό (dashboard) που αναλύει τη συμπεριφορά των χρηστών σε ιστοσελίδες. Στο κέντρο δεσπόζει ένα κυκλικό γράφημα που δείχνει το υψηλό ποσοστό εγκατάλειψης καλαθιού. Γύρω του, ραβδογράμματα και μετρήσεις αναλύουν τους λόγους απώλειας πελατών, όπως το χαμηλό βάθος κύλισης (scroll depth), τα 'rage clicks' και η σύγχυση κατά την πλοήγηση. Το γράφημα συγκρίνει τα επιφανειακά δεδομένα επισκεψιμότητας με τη βαθύτερη ανάλυση εμπειρίας χρήστη (UX) για τη βελτιστοποίηση των εσόδων.
    EyeCaptain
    eyecaptain.io

    Turning Insights into Actionable Improvements

    Collecting behavioral data is only the first step. Data is useless until you act on it. The real value is created when you translate these insights into specific, targeted improvements. Instead of redesigning an entire page based on an assumption, you can use a session recording to identify a single broken link and fix it.

    This precise, data-informed approach yields significant results. Research from the globally recognized Nielsen Norman Group shows that making these types of UX changes can boost key business metrics substantially. The most dangerous assumption is that you already know your users. Every click, scroll, and hesitation tells a story. The only question is: are you ready to listen?

    Enjoyed this article?

    Join 1,500+ professionals getting weekly CRO & UX tips

    🎁 Bonus: Weekly CRO insights + exclusive resources

    No spam. Unsubscribe anytime.

    🚀 Boost Your Conversion Rate with EyeCaptain

    EyeCaptain is an AI-powered CRO & UX analysis tool that automatically scans your pages, identifies UX issues, and gives you actionable optimization suggestions to increase conversions. Try it for free, no card, no commitment.

    Free CRO Audit

    Did you find this helpful?

    Share it with someone who might find it useful.

    Be the first to learn CRO secrets

    Actionable tips, case studies & early access to new AI tools. Weekly in your inbox.

    1,200+ marketers trust us

    Cookie Settings

    We use cookies to improve your experience.