Infographic για digital marketing - οπτικοποίηση εννοιών funnel exploration reports, path analysis, user journey mapping
    eyecaptain.io

    GA4 Funnel Exploration: User Journey Mastery 2026

    Analyze user journeys with GA4 Funnel Reports. Identify leakage points in your sales process and optimize your checkout flow for 2026 success.

    EyeCaptain

    Dimitris

    21 March 2026

    4 min read
    239 views
    GA4 funnel exploration guide 2026user journey mapping analyticsecommerce sales funnel optimization

    Are your standard analytics failing to reveal the complete picture of user behavior? It's time to move beyond surface-level data with GA4 funnel exploration reports. These powerful tools enable deep path analysis and effective user journey mapping, helping you understand the real, often unpredictable, routes customers take on your website or app. This guide explores how to leverage advanced behavior analytics to address the gaps in your data and uncover actionable insights.

    Unlock Deeper Insights with GA4 Funnel Exploration Reports

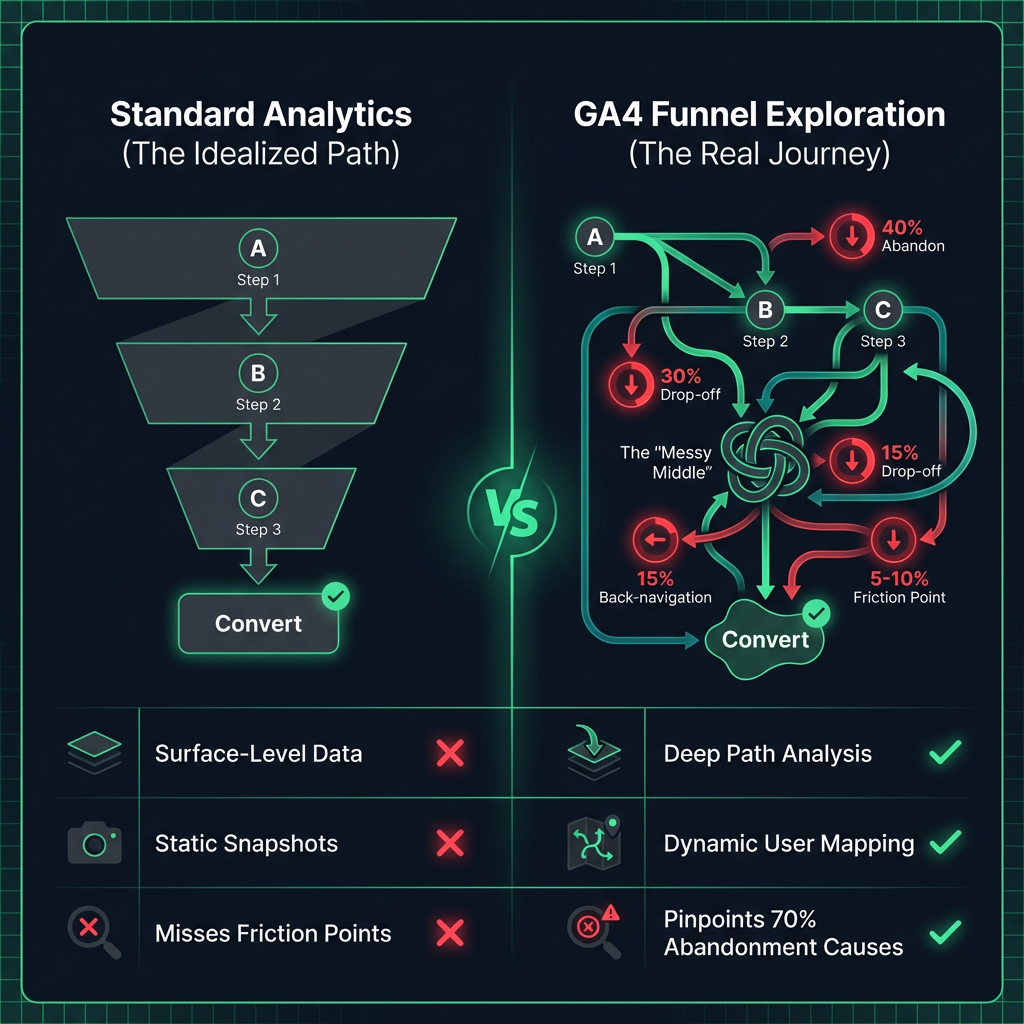
    Unlike traditional analytics that offer static snapshots, funnel exploration reports in GA4 function like a dynamic visualization of your user's experience. This form of advanced behavior analytics allows you to see the complete, non-linear paths people take, moving far beyond simple page-to-page reporting. It is the key to truly understanding the customer journey from first contact to final conversion.

    Understanding the "Messy Middle" with User Journey Mapping

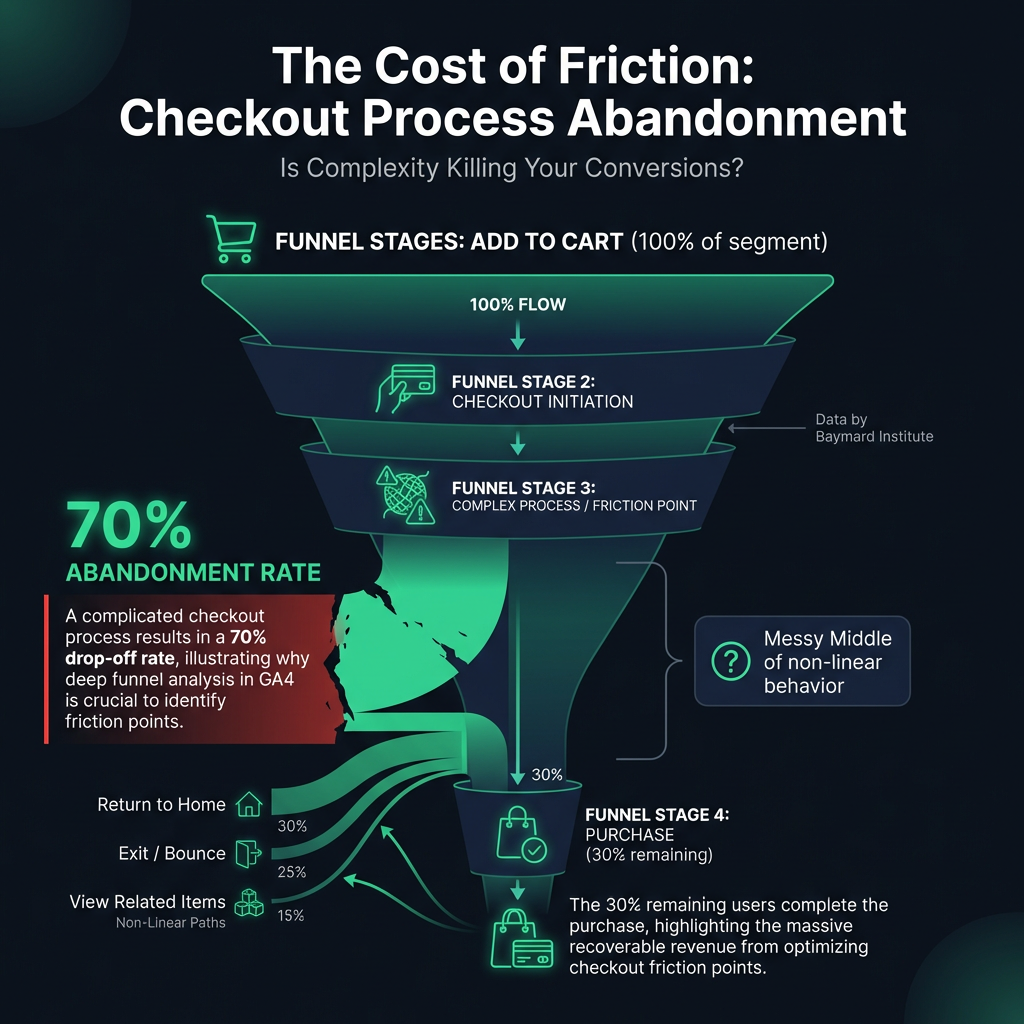
    According to the Baymard Institute, approximately 70% of users abandon a checkout process if it is too complicated.
    Συγκριτικό infographic που αντιπαραβάλλει τα παραδοσιακά analytics με τα GA4 Funnel Exploration reports. Η αριστερή πλευρά δείχνει μια απλοϊκή, γραμμική διοχέτευση (standard funnel), ενώ η δεξιά πλευρά εμφανίζει έναν πολύπλοκο χάρτη πορείας του χρήστη (user journey mapping). Το γράφημα τονίζει πώς η ανάλυση διαδρομής (path analysis) στο GA4 αποκαλύπτει τη μη γραμμική συμπεριφορά, τα σημεία τριβής και τις πραγματικές διαδρομές των χρηστών, σε αντίθεση με τα επιφανειακά δεδομένα των παλαιότερων μεθόδων.
    EyeCaptain
    eyecaptain.io

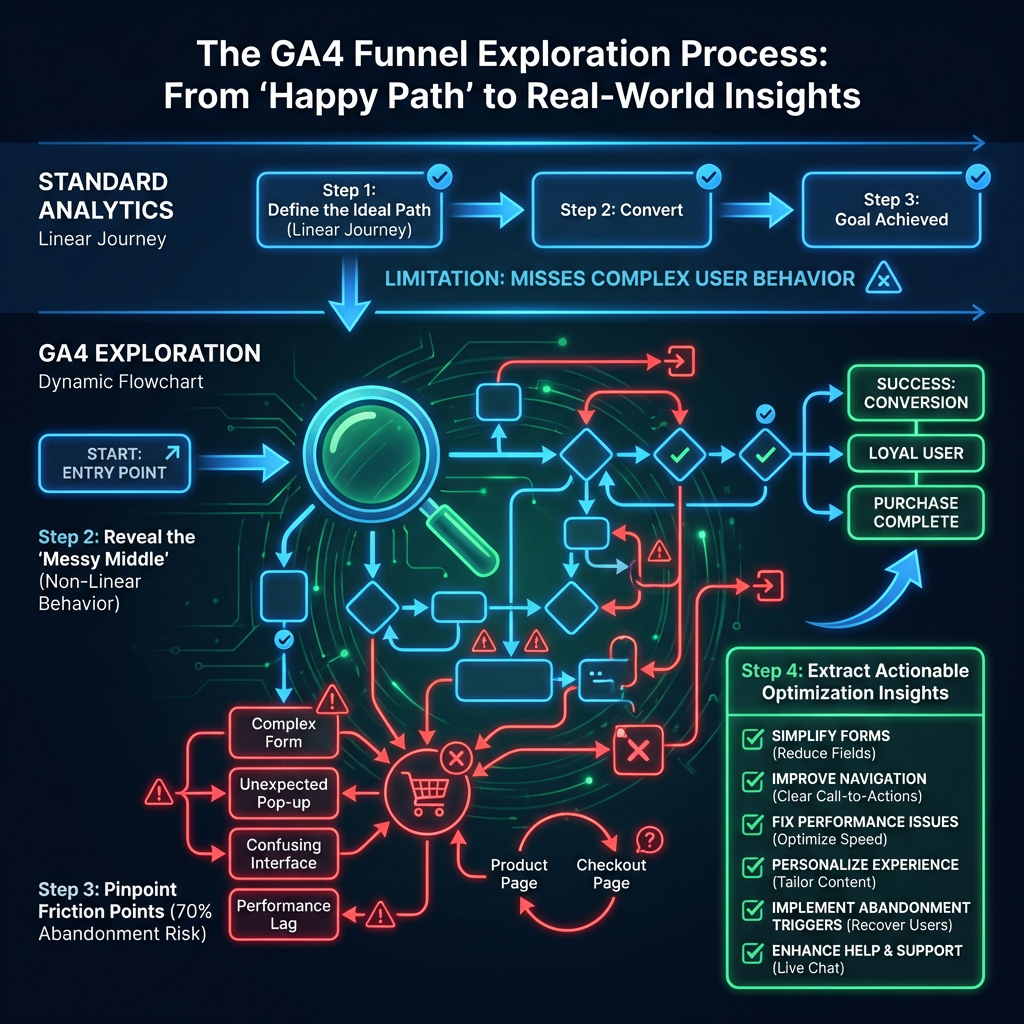
    GA4's funnel reports let you zoom in on exactly where users are abandoning the process. This detailed user journey mapping is like having a microscope for identifying friction points and optimizing your conversion path.

    However, the most valuable insights come from observing how people navigate when they deviate from the ideal "happy path." User behavior is rarely linear. They navigate back, click on related links, get distracted, and perhaps return later. Traditional funnels completely miss this complex user flow, but it is precisely where you will find the biggest opportunities for improvement.

    Digging Deeper with Path Analysis

    Once you begin mapping these journeys, you will want to segment your data to discover the most valuable insights. Effective path analysis is not just about the overall flow; it is about understanding how different user cohorts behave.

    Segmentation is crucial. We partnered with a global SaaS company that initially assumed all its customer segments behaved identically. After helping them segment their GA4 reports, they made a critical discovery: enterprise clients took a completely different and much longer path to conversion than small business users. This single insight from their behavioral data prompted a complete re-evaluation of their marketing strategy.

    Πληροφοριακό γράφημα ροής που παρουσιάζει τη διαδικασία ανάλυσης της συμπεριφοράς χρηστών μέσω των αναφορών χοάνης (funnel exploration) στο GA4. Το διάγραμμα συγκρίνει την ιδανική γραμμική διαδρομή με την πραγματική, πολύπλοκη πλοήγηση των χρηστών ('messy middle'). Απεικονίζει τα βήματα για τον εντοπισμό σημείων εγκατάλειψης και τη χαρτογράφηση του ταξιδιού του πελάτη με στόχο τη βελτιστοποίηση της εμπειρίας χρήστη (UX) και την αύξηση των μετατροπών.
    EyeCaptain
    eyecaptain.io

    When you start layering segments - such as new versus returning users or mobile versus desktop traffic - you unlock even more powerful insights. In fact, research from the Nielsen Norman Group (NNGroup) shows that implementing changes based on this kind of deep path analysis can boost conversion rates by as much as 35%.

    EyeCaptainEyeCaptain
    97%
    Conversions Booster

    Your visitors leave without converting

    Most websites lose 97% of their traffic without a single conversion. Our AI scans 200+ CRO elements to find exactly where visitors drop off.

    Hero CTA missing

    Technical Setup for Accurate Behavior Analytics in GA4

    These insights do not appear automatically; a successful funnel exploration requires thoughtful configuration. The goal is not to track everything, but to track the right events and interactions. You need to carefully map the critical touchpoints in your conversion path and the micro-interactions that signal user intent.

    Key Steps for a Powerful GA4 Setup

    • Map Critical Touchpoints: Identify every essential step a user must take to convert.
    • Track Micro-Interactions: Monitor smaller actions like video plays, form field interactions, or document downloads that indicate engagement.
    • Use Custom Dimensions: This capability is transformative. When you enrich your GA4 reports with custom data points like scroll depth, time on a specific element, or which call-to-action was clicked, your basic funnel report evolves. It ceases to be a set of abstract numbers and begins to tell the real, human story of your user's experience.
    Στατιστικό γράφημα χωνιού (funnel chart) που αναπαριστά τα ποσοστά εγκατάλειψης στο checkout. Το γράφημα τονίζει έντονα ότι το 70% των χρηστών αποχωρούν όταν η διαδικασία είναι περίπλοκη, βασισμένο σε δεδομένα του Baymard Institute. Δείχνει τη ροή των χρηστών από την προσθήκη στο καλάθι μέχρι την τελική αγορά, με οπτική έμφαση στα σημεία τριβής και την απώλεια πελατών.
    EyeCaptain
    eyecaptain.io

    What is the most dangerous assumption you can make? Believing your current funnel data is complete. Every moment you delay a proper user journey mapping initiative, you are allowing potential revenue and leads to be lost due to undiscovered issues in the user experience.

    Enjoyed this article?

    Join 1,500+ professionals getting weekly CRO & UX tips

    🎁 Bonus: Weekly CRO insights + exclusive resources

    No spam. Unsubscribe anytime.

    🚀 Boost Your Conversion Rate with EyeCaptain

    EyeCaptain is an AI-powered CRO & UX analysis tool that automatically scans your pages, identifies UX issues, and gives you actionable optimization suggestions to increase conversions. Try it for free, no card, no commitment.

    Free CRO Audit

    Did you find this helpful?

    Share it with someone who might find it useful.

    Be the first to learn CRO secrets

    Actionable tips, case studies & early access to new AI tools. Weekly in your inbox.

    1,200+ marketers trust us

    Cookie Settings

    We use cookies to improve your experience.