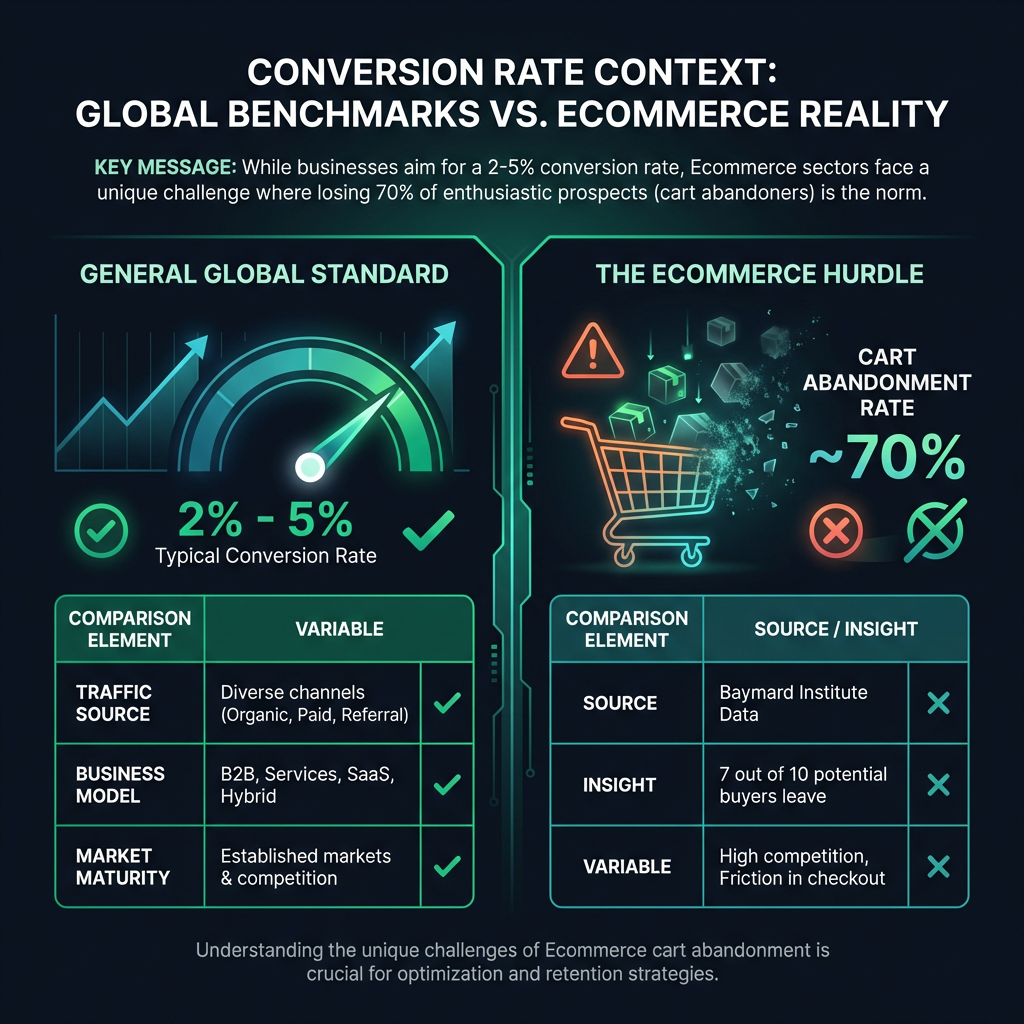

A good conversion rate is one that beats your own baseline for the same page, traffic source and device, not a universal number. As a rough reference from published data, the median Shopify store converts about 1.4% of sessions into orders (Littledata, 2026), and the median landing page converts 6.6% of visitors (Unbounce, 2024). These figures measure different things, which is why they differ by a factor of almost five. Use benchmarks to check that you are in a sane range, then set targets from your own segmented data.
What is a conversion rate and how do you calculate it?
A conversion rate is the share of visits (or visitors) that complete a defined action, such as a purchase, a form submission or a trial signup.
Conversion rate = conversions ÷ denominator × 100
Example: an online store records 120 orders from 6,000 sessions in a week. 120 ÷ 6,000 × 100 = 2.0%.
That looks simple, but two choices in the formula change the result completely: what you count as a conversion, and what you divide by. Get these wrong and you will compare your number with a benchmark that measured something else.
Sessions or users: the denominator matters
Google Analytics 4 reports both. Its documentation defines session key event rate as the share of sessions in which a key event occurred, and user key event rate as the share of users who triggered one. Take the same store: if those 6,000 sessions came from 4,500 unique users, the user-based rate is 120 ÷ 4,500 = 2.67%. Same week, same orders, a third higher. IRP Commerce, for instance, divides transactions by sessions, so a user-based figure from your own analytics cannot be compared with it directly.
What is the average conversion rate? Benchmarks from named sources
The table below only lists figures that come from a named publisher and could be checked against that publisher's own pages. Each row says what was measured, because a landing page median and a whole-store median are different metrics.
| Benchmark | Figure | Source / year / metric |
|---|---|---|
| Median landing page, all industries | 6.6% | Unbounce Conversion Benchmark Report, 2024. Median conversions per visitor across about 41,000 landing pages, 464 million visits and 57 million conversions (July 2023 to July 2024). |
| Median ecommerce landing page | 4.2% | Unbounce Conversion Benchmark Report, 2024. Ecommerce landing pages only, not whole stores. |
| Range of industry medians (landing pages) | 3.8% (SaaS) to 12.3% (entertainment and events) | Unbounce Conversion Benchmark Report, 2024. Industry medians for landing pages. |
| Median Shopify store | 1.4% (mean 1.9%) | Littledata Shopify benchmarks, 2026. Orders per session, 427 stores, 90 days to 10 October 2026. |
| Top 20% / top 10% of Shopify stores | above 2.6% / 3.6% or more | Littledata Shopify benchmarks, 2026. Same sample and metric. |
| Shopify medians by industry | Beauty 2.8%, health and supplements 2.4%, food and beverage 2.3%, fashion 1.2%, home and furniture 0.9% | Littledata Shopify benchmarks, 2026. Orders per session. |
| Shopify medians by device | Mobile 1.5%, desktop 1.5% | Littledata Shopify benchmarks, 2026. Top-10% thresholds differ: 4.0% mobile, 5.1% desktop. |
| Overall ecommerce market | 1.97% (September 2025: 1.68%) | IRP Commerce Ecommerce Market Data, September 2026. Transactions per session across IRP's retail sample. |
| Ecommerce sector spread | Arts and crafts 5.53%, baby and child 0.51% | IRP Commerce Ecommerce Market Data, June 2026. Transactions per session by sector. |
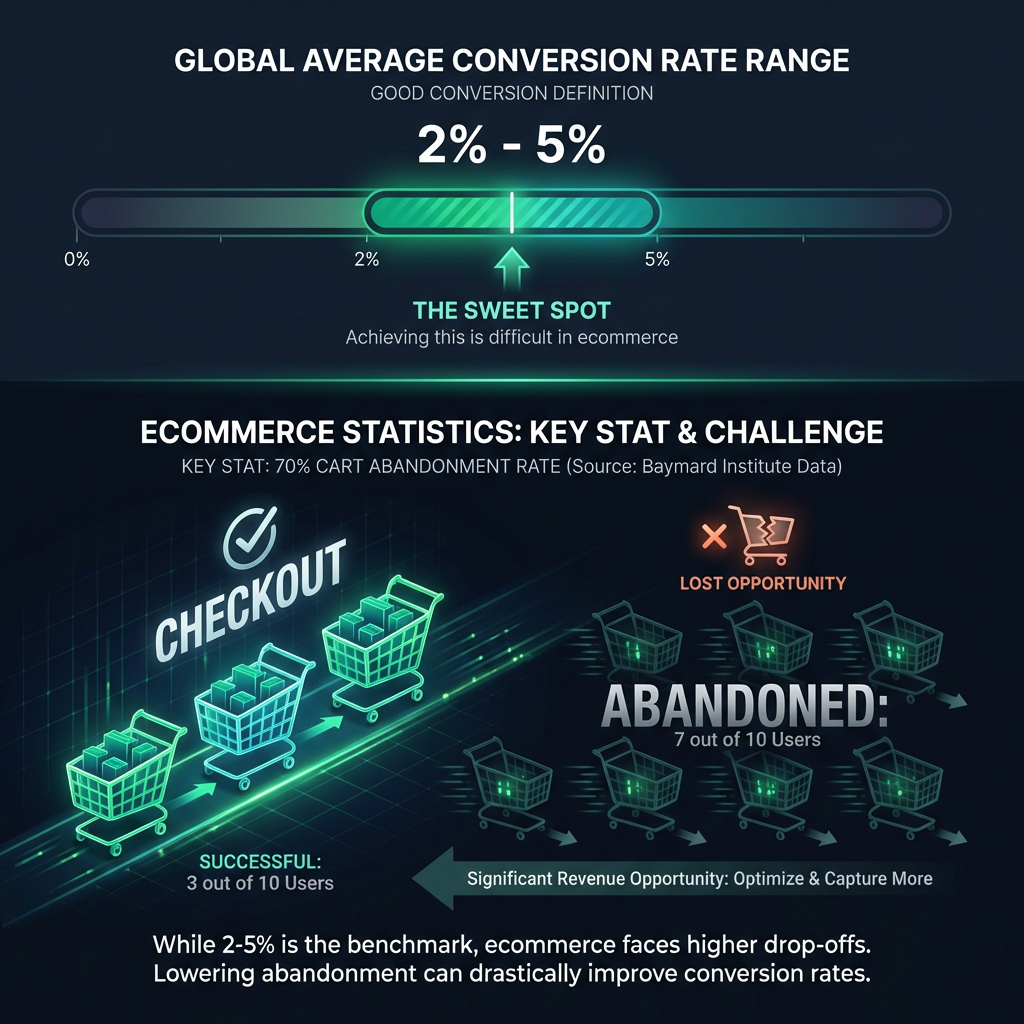
| Cart abandonment | about 70% (70.22%) | Baymard Institute, cart abandonment rate list, 2026. Average of 50 published studies. |
| Checkout design headroom | 35.26% potential increase | Baymard Institute checkout usability research. Baymard's own estimate of the gain an average large ecommerce site could get from checkout design fixes alone. |
Two things stand out. First, landing page benchmarks run several times higher than whole-store benchmarks, because a landing page has one job and usually receives intent-matched paid traffic, while a store's sessions include browsers, returning customers checking an order and people who arrived on a blog post. Second, even within ecommerce the sector spread in IRP's data is roughly tenfold. A single "average conversion rate" hides most of what matters.
Benchmark tools from vendors such as Dynamic Yield also publish device and industry cuts, but the figures are drawn from each vendor's own client base. Check the methodology on the publisher's page before you quote any number from them.

Why does conversion rate by industry vary so much?
Six factors change the number before your design or copy has any effect.
- What counts as a conversion. A newsletter signup, a free trial and a $2,000 purchase are not the same action. Unbounce's landing page data mixes lead forms and clicks through to offers; Littledata and IRP count only orders.
- The denominator. Sessions, users, or only visitors who reached a product page. Each produces a different rate from the same orders, as the formula example above shows.
- Device. Littledata's 2026 medians are level at 1.5% for mobile and desktop, but the top-10% thresholds differ (4.0% versus 5.1%), so the ceiling depends on device mix.
- Traffic source. Email to existing customers and branded search convert far higher than cold social traffic. A change in channel mix moves the overall rate even if no page changes.
- Price point. A $40 consumable and a $1,200 sofa have different decision cycles. Lower conversion at a higher price is normal and can still mean more revenue.
- Funnel stage. A product page, a pricing page and a checkout step each have their own expected rate. Comparing a checkout step with a site-wide benchmark is meaningless.
Why averages mislead: two worked examples
Example 1: the "worse" store makes more money
Store A sells supplements at a $40 average order value and converts 3.0% of sessions. Store B sells furniture at a $1,200 average order value and converts 0.8%. Against a 1.4% median, A looks good and B looks weak.
- Store A revenue per session: 0.030 × $40 = $1.20
- Store B revenue per session: 0.008 × $1,200 = $9.60
Store B earns eight times more per visit. If B "fixed" its conversion rate by discounting heavily, it could raise the rate and lose money. Revenue per session (or margin per session) is the number to watch alongside the rate.
Example 2: every segment improved, but the total fell
A store compares two months. Desktop and mobile both improved, yet the overall conversion rate dropped.
| Segment | Month 1 | Month 2 |
|---|---|---|
| Desktop | 10,000 sessions, 400 orders (4.0%) | 6,000 sessions, 270 orders (4.5%) |
| Mobile | 10,000 sessions, 100 orders (1.0%) | 18,000 sessions, 216 orders (1.2%) |
| Total | 20,000 sessions, 500 orders (2.5%) | 24,000 sessions, 486 orders (2.03%) |
The cause is mix, not performance: traffic shifted towards mobile, which converts lower. This is Simpson's paradox, and it is the most common reason a team "loses" conversion rate after a successful mobile campaign. Always read conversion rate by segment before reacting to the total.
Landing page conversion rate benchmark: how to use it correctly
Unbounce's 6.6% median applies to standalone landing pages, usually receiving paid traffic for one offer. Do not compare your homepage or a category page with it. If you run paid campaigns, the closer comparison is your own campaign landing pages against Unbounce's industry median, and then against each other. Message match between the ad and the page explains much of the gap; our guide to ad scent and Google Ads landing page conversion rate covers how to check it.
For the page itself, the practical work is in clarity of offer, form length and the position of the call to action. See the landing page optimization guide for a structured approach.
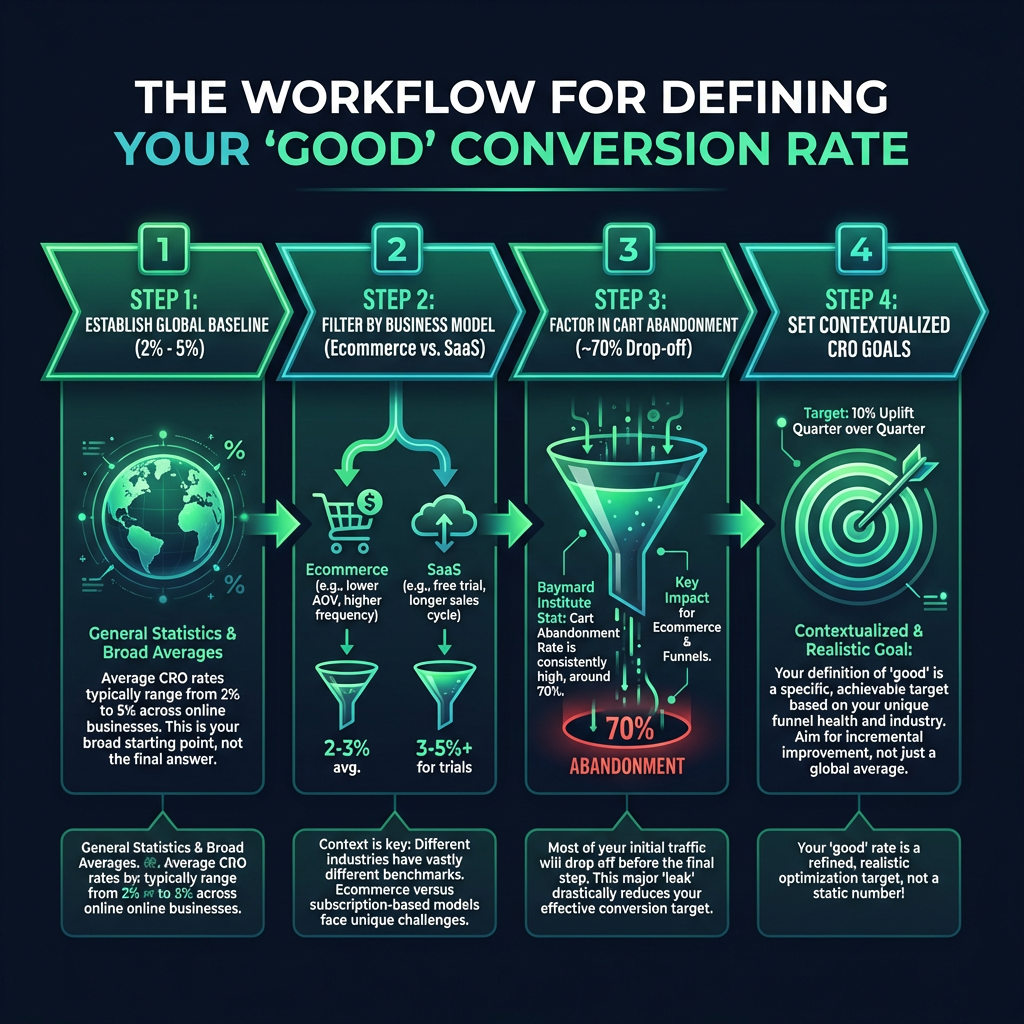
What is a good conversion rate for a website? How to set your own target
A benchmark tells you whether you are in a plausible range. A target should come from your own data. Use these five steps.