
To achieve successful outcomes, understanding the statistical significance of your A/B test is not just important - it is essential. Many marketers believe they are running scientific experiments, but without a proper A/B testing methodology, they often make critical business decisions based on statistically unreliable results. This can lead to wasted resources and, even worse, a decrease in your overall conversion rates.
It is time to move beyond guesswork and implement a framework for dependable results. We will explore why many tests fail, how to correctly interpret statistical significance, and the common mistakes that could be undermining your entire testing strategy.
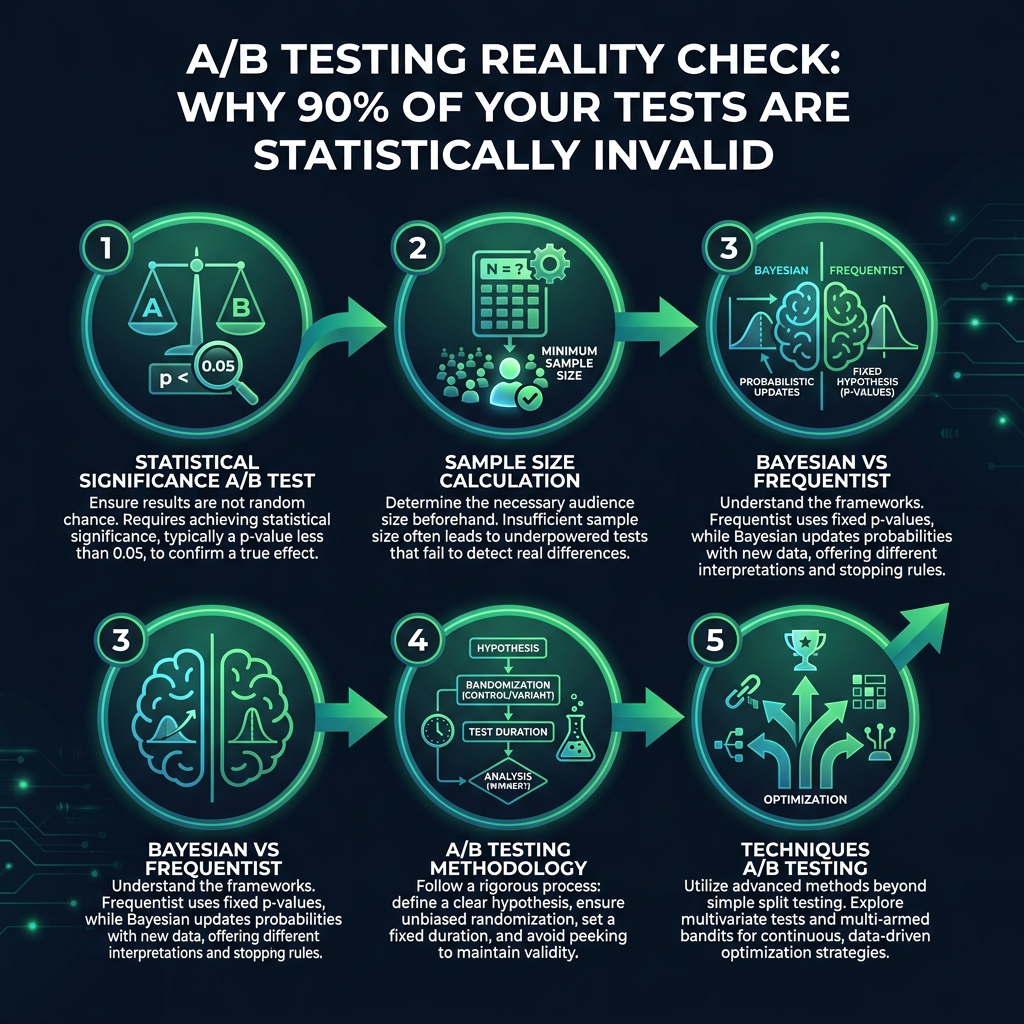
Understanding Statistical Significance in A/B Testing
Statistical significance is the crucial dividing line between making intelligent, data-driven decisions and simply guessing. It confirms that the results of your test are not due to random chance but are instead a likely outcome of the changes you made. When a result is statistically significant, you can be confident that one variation is genuinely performing differently from another.
A revealing study by the Baymard Institute, which analyzed thousands of e-commerce experiments, highlighted a widespread problem: the vast majority of tests failed to reach the minimum sample size required for a meaningful result. This points to a fundamental flaw in many common A/B testing approaches.
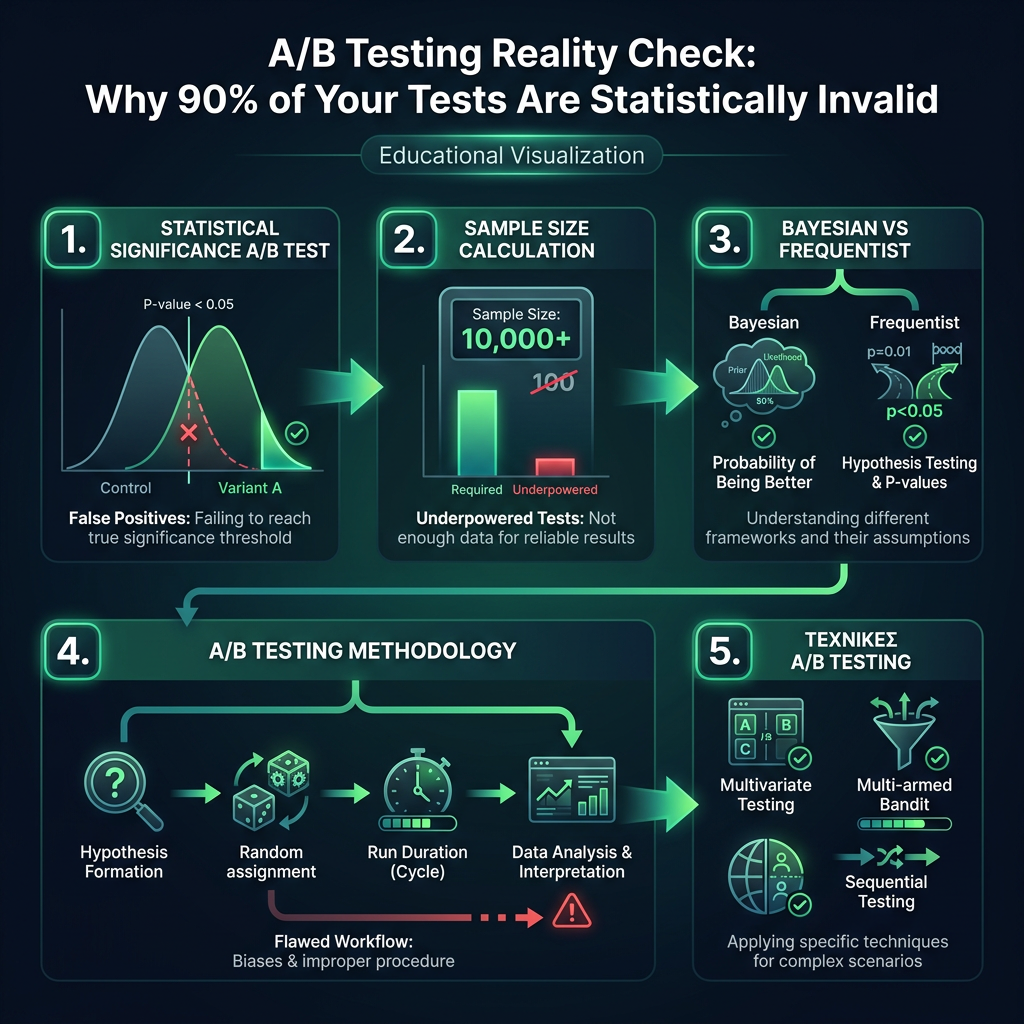
The Importance of Sample Size Calculation
The core issue that invalidates most A/B tests is an inadequate sample size. If you run a test on only a few hundred visitors and declare a winner, you have not gathered enough data to learn anything conclusive. Mathematically, the results are likely random noise, not a true signal of user behavior. A proper sample size calculation is the foundation of any valid A/B test.
You do not need to be a statistician to determine your sample size, but you do need to understand the concept of statistical power. This calculation relies on three key inputs:
- Baseline Conversion Rate: Your current conversion rate for the original page (the control).
- Minimum Detectable Effect (MDE): The smallest improvement you want to be able to detect. A smaller MDE requires a larger sample size.
- Statistical Significance / Confidence Level: How confident you want to be in the result. The global industry standard is 95% confidence.
For example, if your baseline conversion rate is 3% and you want to reliably detect a 15% uplift with 95% confidence, your sample size calculation would show that you need several thousand visitors for each variation. Ending a test prematurely with insufficient traffic is the primary reason tests produce unreliable, statistically insignificant results.
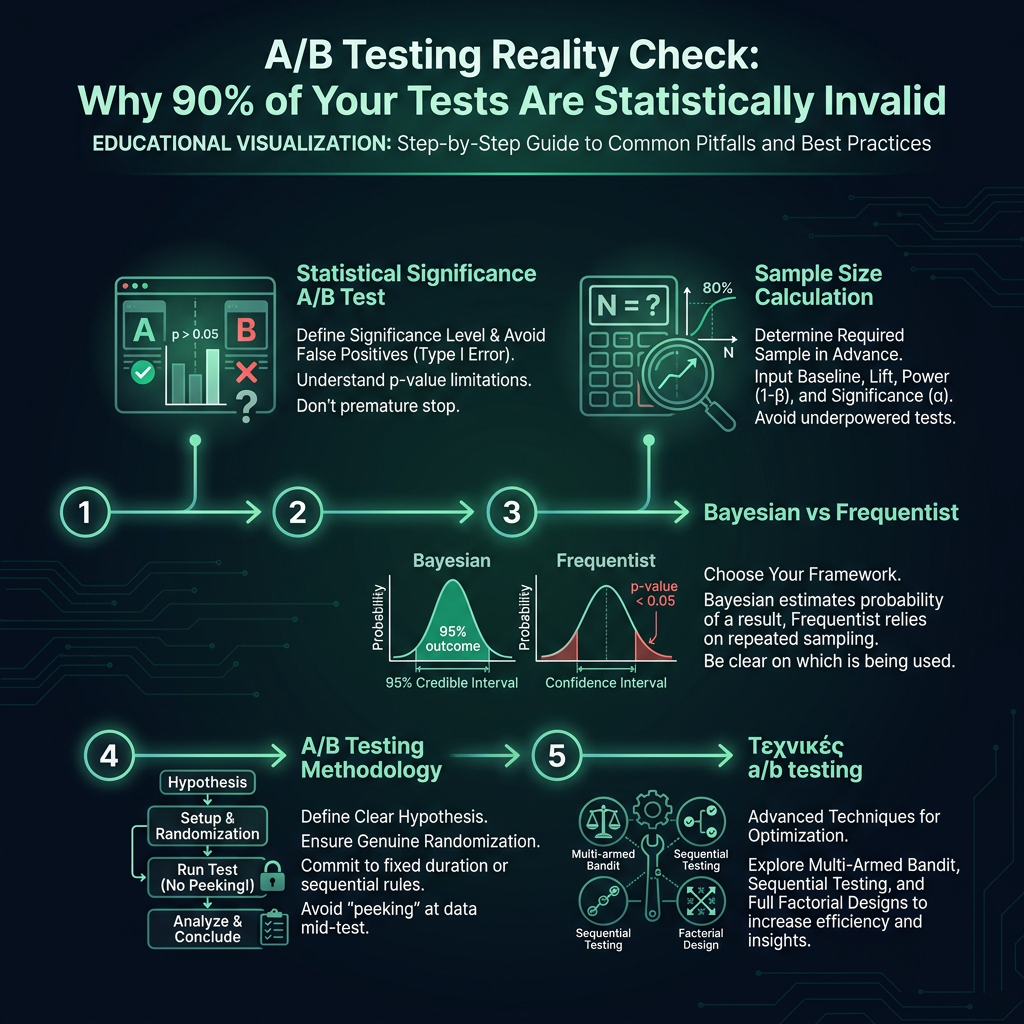
Bayesian vs. Frequentist: A Key Debate in A/B Testing Methodology
A less-known but critical aspect of A/B testing methodology is the statistical approach used to analyze results. The two primary schools of thought are the traditional Frequentist method and the more modern Bayesian method. Understanding the difference is key to selecting the right tools and interpreting your data correctly.