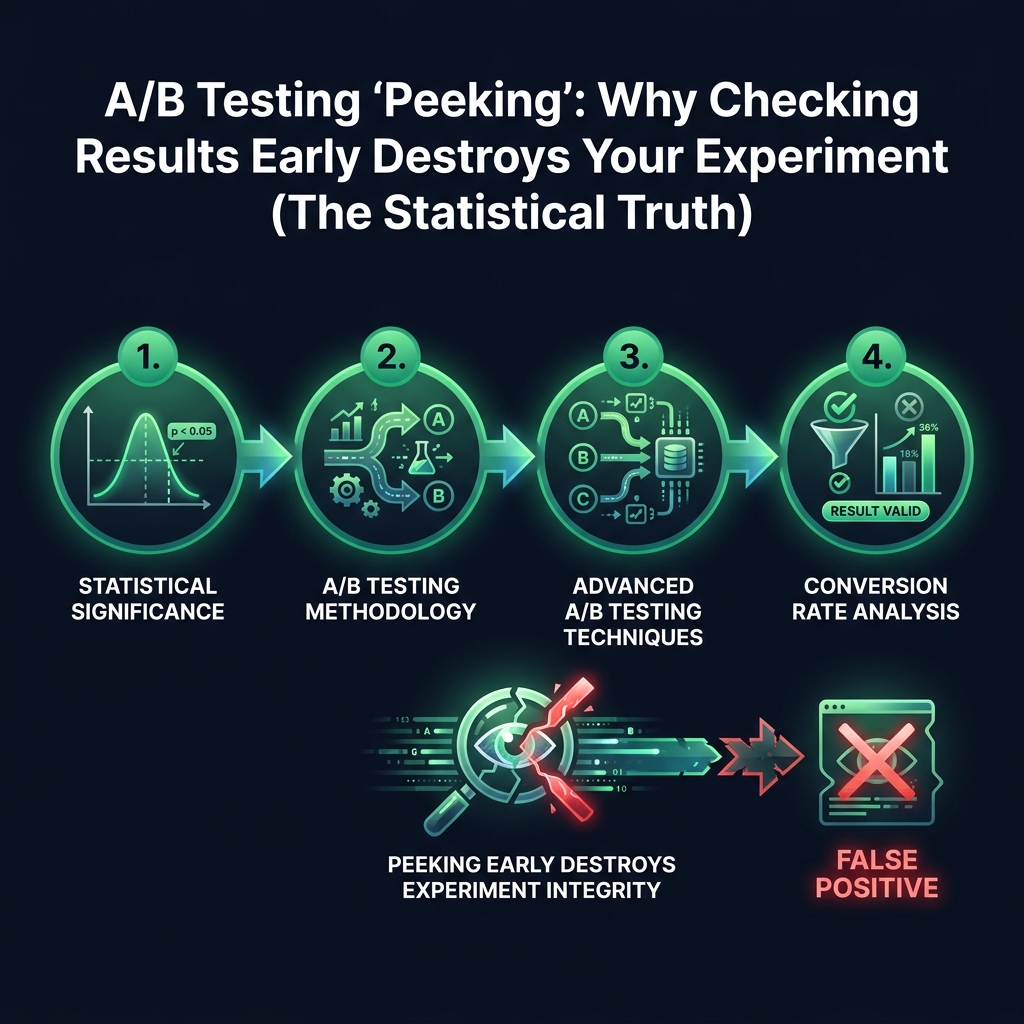

Discovering a winning variant in your A/B test feels like a significant achievement, but stopping the test early based on promising initial data can invalidate your entire experiment. A proper A/B testing methodology is built on understanding true statistical significance, which is essential for accurate conversion rate analysis. Without it, you risk implementing changes that actually harm your business, all because of a common statistical trap.
That impressive lift you see after just a few days might be a complete mirage. The moment you peeked at your results early, you may have contaminated the test. This is not just an opinion; it is a statistical pitfall called the "peeking problem," and it is quietly undermining conversion rates on countless websites.
Let's break down why looking early is so dangerous, what statistical significance actually means, and how you can run tests with results you can truly trust.
The Peeking Problem: Why Early A/B Test Analysis Is Flawed
Every time you glance at your A/B test results before the predetermined end date, you force a decision: stop the test or let it run? Even if you let it continue, you have already introduced a significant bias.
Here is why: statistical results are not stable, especially in the early stages of a test. They fluctuate wildly due to normal variance. For example:
- After 100 visitors, your new variant might show a 40% lift.
- By 500 visitors, that lift could drop to 12%.
- At 2,000 visitors, it might be down to just 3%.
When you peek repeatedly, you increase your chances of catching the test during one of these random, temporary highs. This dramatically raises the odds of being fooled by a false positive. Think of it like flipping a coin ten times and claiming victory the first time it lands on heads. Your odds of "winning" increase dramatically, not because of skill, but because you gave yourself more opportunities to get lucky.
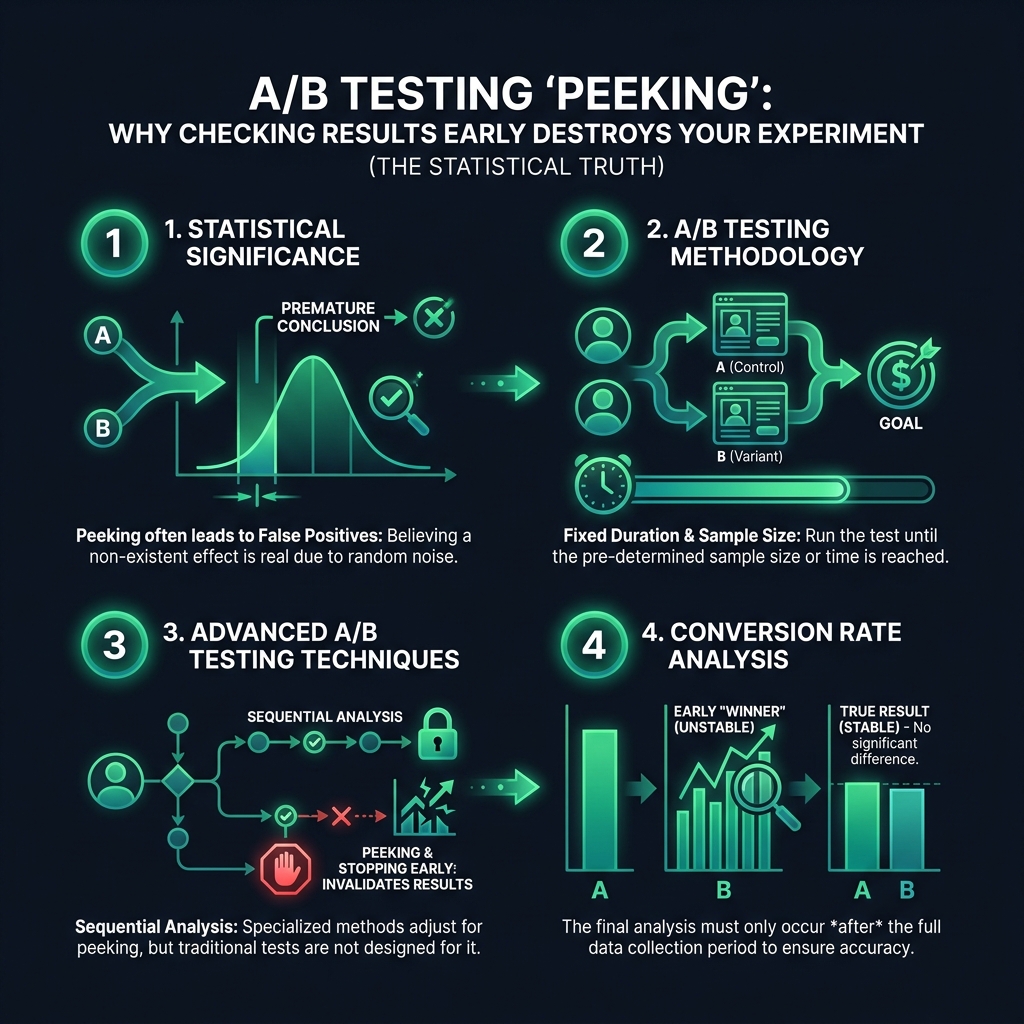

This is not just a theory. Research from leading experimentation platforms has found that peeking can inflate the false positive rate from the standard 5% to as high as 29%. That means nearly one in three "winning" variants you implement early are not actually winners at all. This flawed approach to conversion rate analysis could lead you to implement changes that actively harm your business while you believe you are making improvements.
The technical term for this is "alpha inflation." Each peek is a separate gamble carrying its own risk of error. When you compound these risks, you are no longer making data-driven decisions; you are simply gambling.
What Statistical Significance Really Means for Conversion Rate Analysis
Many marketers treat 95% statistical significance as a finish line. The moment a dashboard hits that number, they declare a winner and move on. However, this reflects a fundamental misunderstanding of the concept.
Statistical significance simply indicates the probability that the observed result is a product of random chance. At 95% significance, there is still a 5% chance you are looking at statistical noise, not a real signal. This 5% risk is only acceptable if you follow the rules of the test.
The core rule of frequentist A/B testing is this: the math behind statistical significance assumes you will analyze the data only once, after the experiment has collected a predetermined sample size.
When you peek multiple times, you violate the foundational assumption on which the entire calculation rests. It is like changing the rules of a game to guarantee a win. If you get to draw from a deck of cards ten times to find an ace, your odds of success skyrocket compared to a single draw. The deck did not change, but the rules did. Peeking at your A/B test is changing the rules.
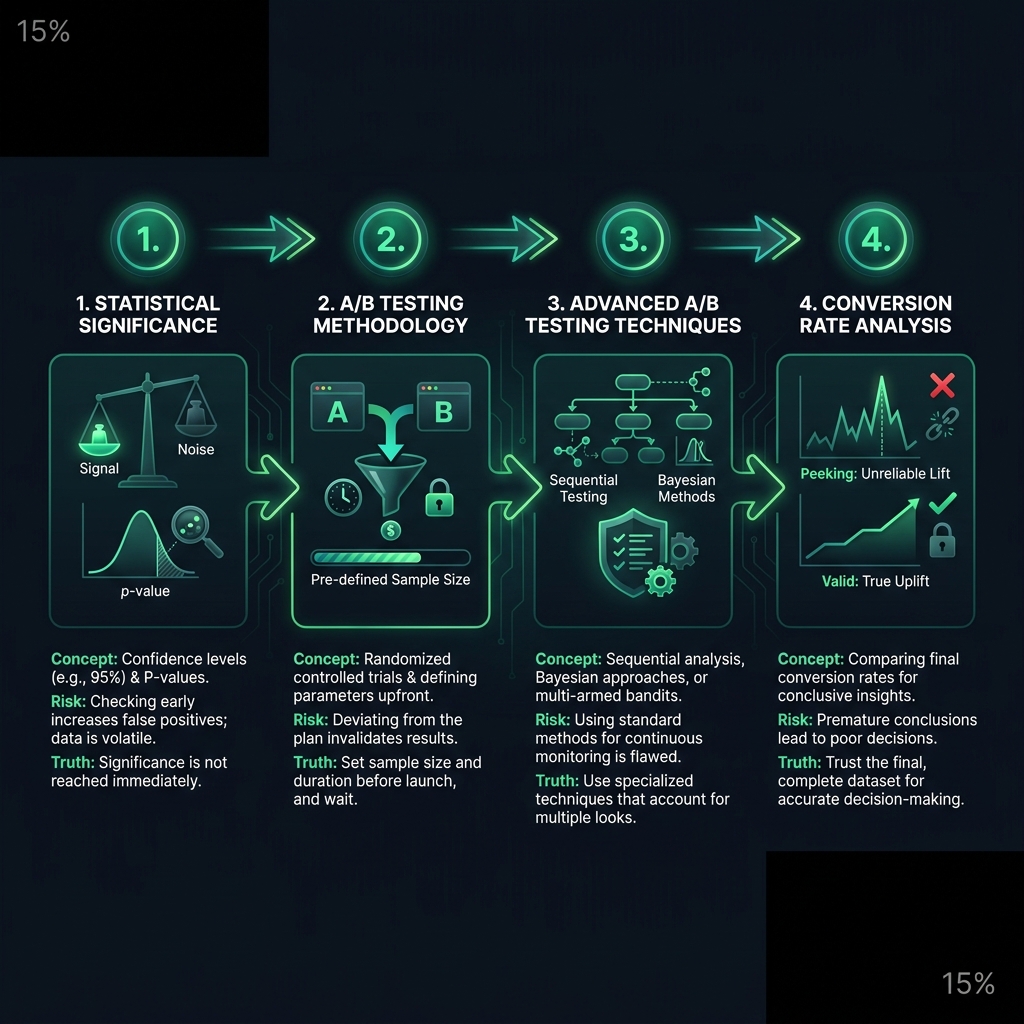
The solution is not a complex formula but simple discipline. Before starting your test, follow this process: