
Struggling with inconclusive A/B testing results? When your conversion rate analysis shows no clear winner, it's common to feel your efforts were wasted. However, a result that lacks statistical significance is not a failure; it's a valuable data point that requires a deeper UX analysis to unlock its true meaning and inform your next steps.
It can feel as though you've invested significant time, traffic, and budget for no clear return. But what if that's not the case? The problem isn't the test, but how you interpret the results when the outcome is inconclusive. These results are not failures; they are data points that require a new perspective.
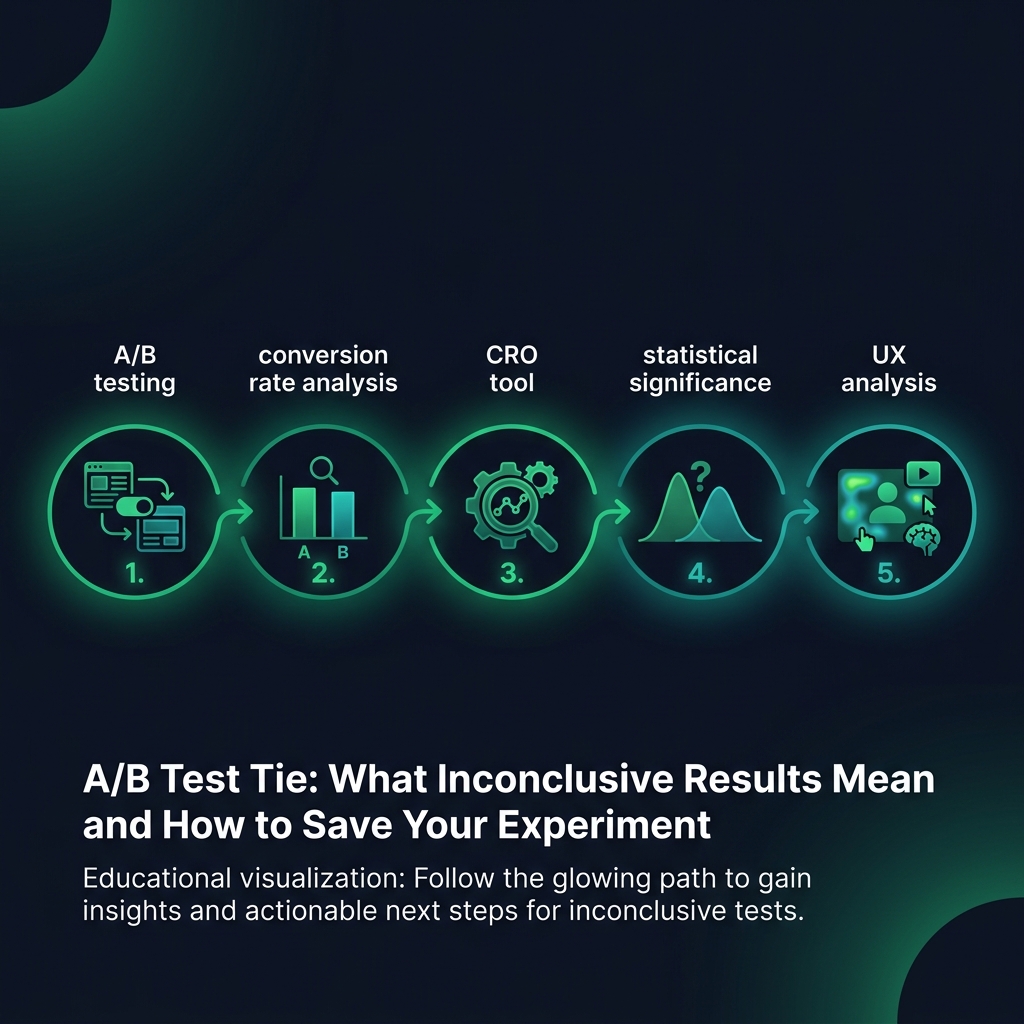
Why A/B Testing Results Are Often Inconclusive
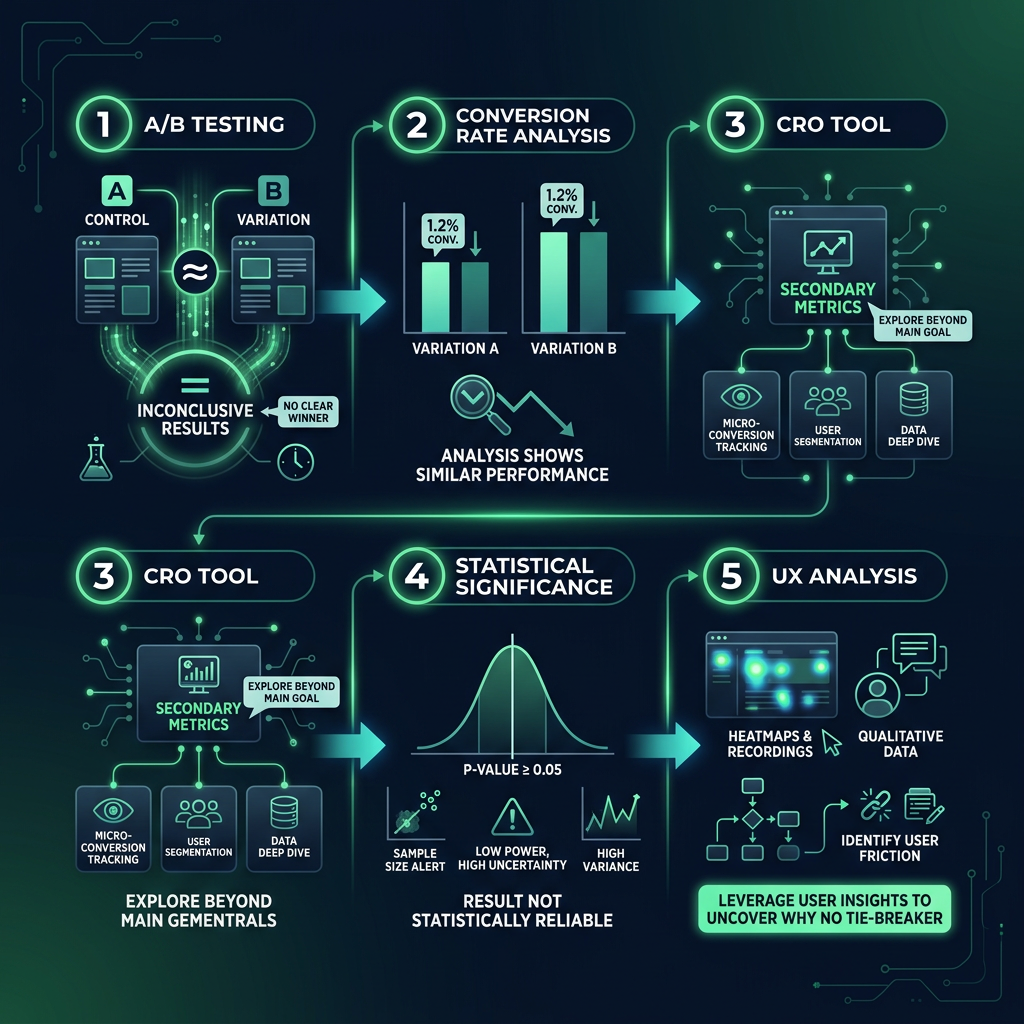
An "inconclusive" result in A/B testing means your two versions performed so similarly that the data cannot confidently declare one is better than the other. The performance difference is too small to be distinguished from the natural randomness of user behavior. This is a common scenario in conversion rate optimization (CRO) and usually happens for a few key reasons.
Your Sample Size Was Too Small
You might have needed 5,000 visitors per variation to achieve statistical significance, but you only received 500. With a small audience, you cannot reliably detect a small change in performance. It's like trying to hear a whisper at a rock concert. For example, the Baymard Institute notes that to detect a 10% lift in cart abandonment, you need at least 350 conversions for each variant - a volume many websites do not reach quickly.
The Tested Change Was Too Subtle
Changing a blue button to a slightly different shade of blue rarely creates a massive shift in user behavior. If your baseline conversion rate is 2.1% and your new version reaches 2.3%, you would need an immense amount of traffic to prove that tiny lift wasn't just random chance. The effect of your change might be real, but it's simply too faint for your A/B testing to measure accurately.

Your Audience Behavior is Segmented
This is a critical insight often missed in a top-level conversion rate analysis. Perhaps your mobile visitors responded well to the new design, while your desktop users did not. When you look at the aggregate numbers, these two strong reactions can cancel each other out, making the result appear inconclusive. The real story is often hidden just beneath the surface, but many analysts stop investigating here. This is where a proper UX analysis begins.
How to Analyze Inconclusive A/B Test Results
A statistically inconclusive result doesn't mean your change had no impact. It often means the impact was smaller than your test could measure, or it's buried in audience segments you haven't examined yet. To find these hidden insights, you need to look beyond the overall result.
Dig Deeper with Segmentation
Do not just look at the overall numbers. Break your A/B testing results down by meaningful segments. A comprehensive CRO tool can simplify this process. Analyze the data by:
- Device type (mobile vs. desktop vs. tablet)
- Traffic source (organic, paid, social, direct)
- New vs. returning visitors
- Geographic location (country or region)
Run the statistical significance calculation on each of these smaller groups. You will often find a clear winner for a specific segment that was obscured in the main report. For example, an e-commerce store found a new checkout flow was inconclusive overall. But after segmentation, they saw mobile users converted 41% better with the new flow - a massive win hidden in the aggregate data.